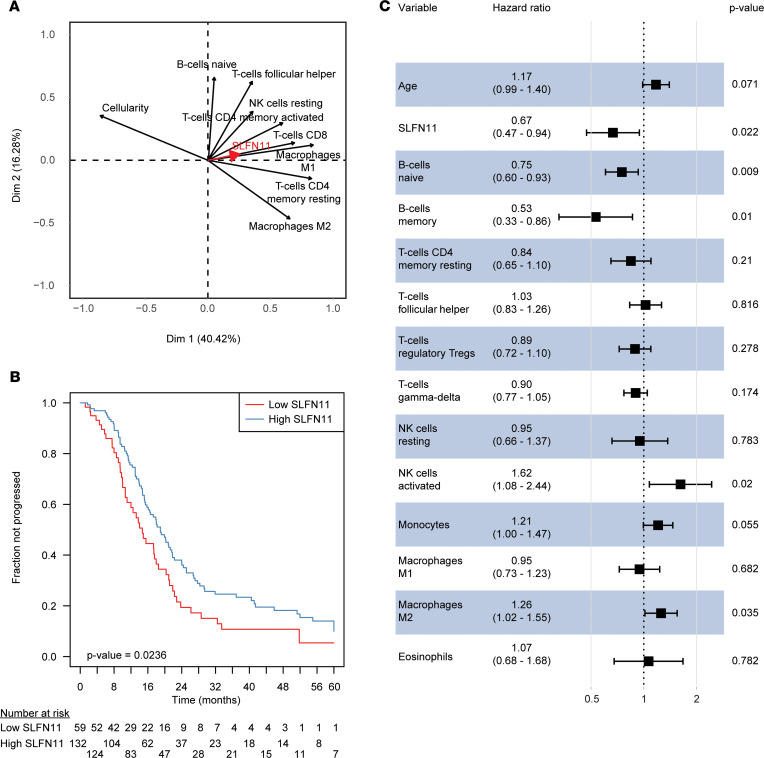
Figure 4. SLFN11, immune cell subpopulations, and prognosis in TCGA serous ovarian carcinoma data set.
(A) Variable correlation plot of the PCA including SLFN11 transcript, cancer cellularity, and CIBERSORTx immune cell subpopulations significant by univariable correlation at FDR < 0.05. The 2 axes represent the first principal components explaining the greatest fraction of the variance of the analyzed data set, with percentage of explained variability in parentheses. The relative position of the variables toward each other explains their relative correlation, whereas their distance from the intersect accounts for their contribution to the components. SLFN11 is represented with a thick red arrow for sake of clarity. (B) Kaplan-Meier plot showing PFI stratified by SLFN11 transcript (“high” if above the lower tertile of expression in the data set, “low” if below). The progressed fraction of patients (y axis) is plotted against time expressed in months from the end of first-line CT, censored at 60 months (x axis). Numbers at risk are reported below the plot. P value in the bottom left of the plot is from the Wald statistics for the univariable Cox’s regression. (C) Forest plot of hazard ratios (x axis, in log scale) for variables retained in the lasso-selected multiple Cox’s regression model. Point HR estimates are reported below each variable together with 95% CIs in parentheses, whereas adjusted P values for each variable are on the right side of the plot. Filled black squares represent HR estimates, with relative 95% CIs shown as horizontal lines with brackets.

