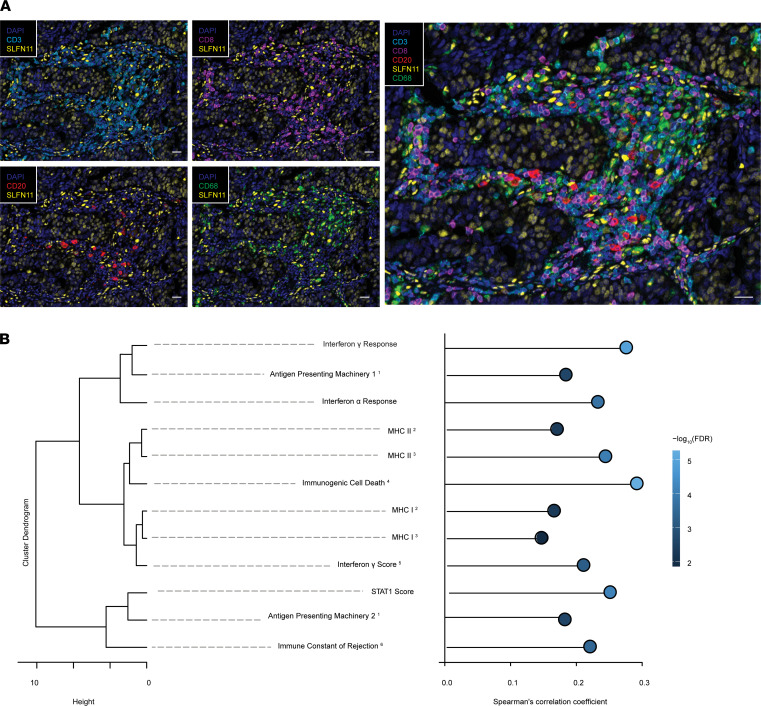
Figure 5. SLFN11 is expressed in a subset of immune-related cells and is associated with immune signatures in HGSOC.
(A) Multiplex immunofluorescence for SLFN11 in T cells (CD3+CD8+), B cells (CD20+), and macrophages/monocytes (CD68+) infiltrating HGSOC tissue. Scale bars: 50 μm. (B) Dendrogram representing the similarity between different immunologic signatures calculated in TCGA ovarian cancer data set (n = 302 cases). X axis represents the Ward’s D2 distance. Signature names have superscript numbers to denote the publication they are derived from: 1: (32); 2: (31); 3: (30); 4: (38); 5: (28); if not specified, signatures are from 6: (27). Right: lollipop plot of correlations between SLFN11 and the aforementioned signatures. X axis represents the Spearman’s correlation coefficient between SLFN11 expression in TCGA ovarian cancer data set and the investigated signatures, whereas individual dots are colored by –log10 of the FDR of the correlation.

