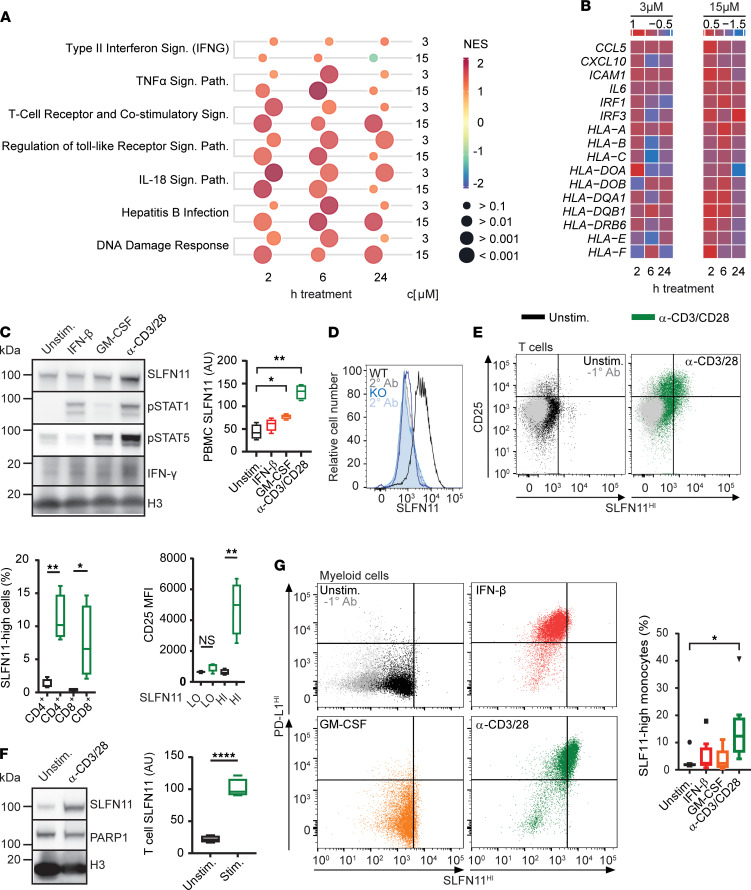
Figure 6. SLFN11 is a dual biomarker capturing simultaneously interconnected immunological and cancer cell–intrinsic functional dispositions associated with sensitivity to platinum treatment.
(A) Bubble chart representing significantly enriched pathways during treatment with cisplatin in SLFN11hi (n = 3) versus SLFN11lo (n = 4) ovarian cancer cell lines. The bubble size indicates the q value (FDR), whereas the color represents the direction of the change as normalized enrichment score (NES), with red indicating a positive enrichment of the comparison and blue a negative one. c, concentration. (B) Heatmap of log fold changes of selected immune-related transcripts for the comparison between the SLFN11hi and SLFN11lo cancer cell lines at the same time points as for A. (C) PBMCs were incubated with IFN-β, GM-CSF, or anti-CD3/CD28 beads for 24 hours and immunoblotted as indicated. Chart shows SLFN11 densitometry (n = 4). (D) DU145 parental or SLFN11-KO cells were stained with/without anti-SLFN11 and analyzed by flow cytometry. (E) PBMCs were treated as in C and analyzed by flow cytometry. FACS plots show SLFN11 and CD25 expression in naive (top) and anti-CD3/CD28-stimulated (bottom) cultures. Charts show quantification of SLFN11hi CD4+ and CD8+ T cells (top) and CD25 expression in SLFN11hi/SLFN11lo T cells (bottom). (F) Purified CD3+ T cells were stimulated with anti-CD3/CD28 beads and immunoblotted as indicated. Chart shows SLFN11 densitometry (n = 4). (G) PBMCs were treated as in C and analyzed by flow cytometry for SLFN11 and programed cell death ligand 1 (PD-L1) expression in myeloid cells. Chart shows quantification of SLFN11hi myeloid cells (n = 8). The box plots depict the minimum and maximum values (whiskers), the upper and lower quartiles, and the median. The length of the box represents the interquartile range. All data in graphs are presented as mean ± SEM. Statistics by Student’s t test, pairwise comparisons with the 2-tailed t test with reported P values adjusted for family-wise error using the Holm’s method. *P < 0.05; **P < 0.01; ****P < 0.0001.

