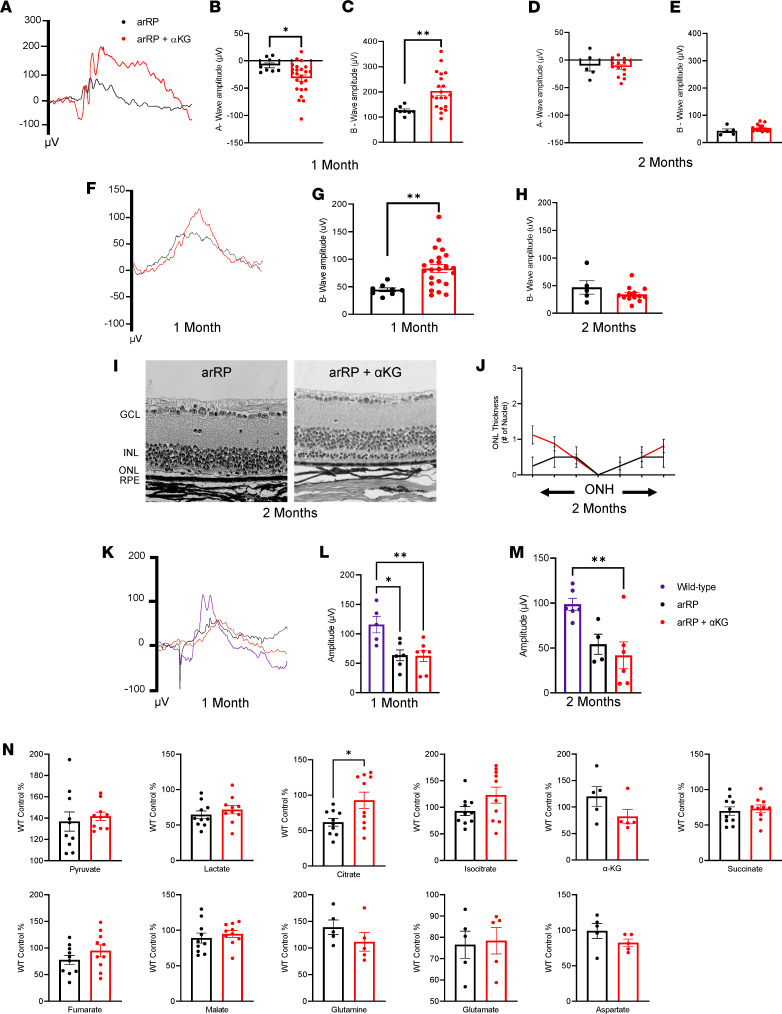
Figure 2. Supplementation with α-KG delays photoreceptor death, elevating citrate levels in the retina.
(A) Representative ERG traces for untreated (black) and α-KG–treated (red) arRP mice at a 2.5 log cd•s/m2 flash intensity. (B) Quantification of a-wave and (C) b-wave amplitudes shows a significant increase in visual response in arRP mice treated with α-KG, (D) which was not significant at 2 months for either the a-wave (E) or b-wave. (F) Representative ERG traces at a –1.1 log cd•s/m2 flash intensity. (G) Quantification of the b-wave amplitude shows a significant increase in visual response in arRP mice treated with α-KG, (H) which was not significant at 2 months. n ≥ 5 eyes. (I) Histology of arRP retinas untreated or treated with α-KG. Scale bar: 50 μm. (J) Morphometric quantification of ONL thickness spanning from the ONH. n = 3 eyes each group, with multiple counts per eye. Analyzed by multiple 2-tailed t tests with the Holm-Sidak method to correct for multiple comparisons. (K) Photopic ERG traces at a 3.1 log cd•s/m2 flash intensity. (L) Quantification of the peak amplitude for WT mice (purple), untreated arRP mice, and arRP mice treated with α-KG at 1 (M) and 2 months of age. n ≥ 5 eyes. Analyzed by 1-way ANOVA followed by Tukey’s multiple comparisons test. (N) Mass spectrometry for the relative abundance of TCA cycle intermediates in the retinas from untreated arRP mice and α-KG–treated arRP mice at 1 month of age. n ≥ 10 retinas. Scotopic ERG and mass spectrometry analyzed by student’s t test. Data are represented as mean ± SEM. *P < 0.05; **P < 0.01. α-KG, α-ketoglutarate; ERG, electroretinogram; arRP, autosomal recessive retinitis pigmentosa; GCL, ganglion cell layer; INL, inner nuclear layer; ONL, outer nuclear layer; RPE, retinal pigment epithelium; ONH, optic nerve head; TCA, tricarboxylic acid.

