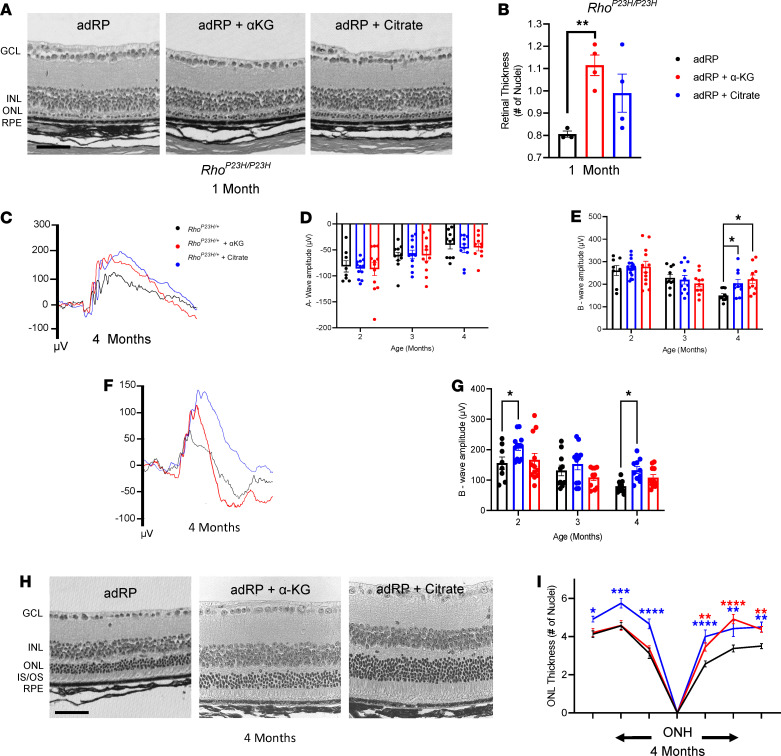
Figure 7. Citrate and α-KG provide photoreceptor resilience against death and prolong visual function during adRP disease.
(A) Histology of the untreated and the adRP retina treated with either α-KG or citrate. (B) Quantification of photoreceptor nuclei thickness, spanning from the ONH to either direction. n ≥ 3 eyes. (C) Representative ERG traces for adRP mice (black) and adRP mice treated with α-KG (red) or citrate (blue) at a 2.5 log cd•s/m2 flash intensity. (D) Quantification of the a-wave and (E) b-wave amplitude. (F) Representative ERG traces at a –1.1 log cd•s/m2 flash intensity. (G) Quantification of the b-wave amplitude. n ≥ 8 eyes. (H) Histology of the untreated and the adRP retina treated with α-KG or citrate. Scale bar: 50 μm. (I) Morphometric quantification of ONL thickness spanning from the ONH. n ≥ 3 eyes. Statistical analysis by 1-way ANOVA (B) or 2-way ANOVA with Tukey’s multiple comparisons test (D, E, G, and I). Data are represented as mean ± SEM. *P < 0.05; **P < 0.01; ***P < 0.001; ****P < 0.0001. Red and blue asterisks reflect significance of α-KG–treated and citrate-treated mice, respectively, in comparison with untreated controls. α-KG, α-ketoglutarate; adRP, autosomal dominant retinitis pigmentosa; GCL, ganglion cell layer; INL, inner nuclear layer; ONL, outer nuclear layer; IS/OS, inner and outer segments; RPE, retinal pigment epithelium; ONH, optic nerve head; ERG, electroretinogram.

