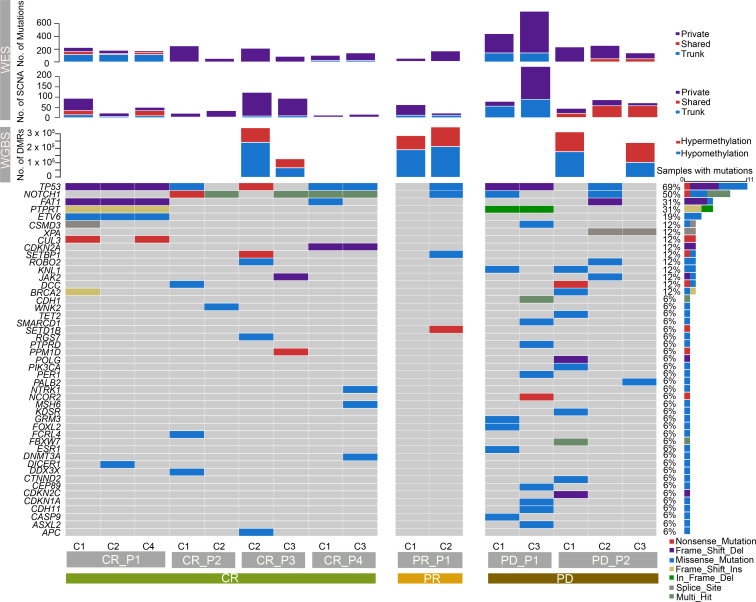
Figure 2. Profiles of molecular alternations due to treatments.
Each column represents a sample obtained from serial checkpoints under combined therapies. The top 3 panels depict a specific molecular landscape, including the number of somatic mutations, somatic copy number aberrations (SCNAs), and differentially methylated regions (DMRs). The bottom panel shows somatic driver mutations in different groups. Mutation frequencies are displayed on the right.

