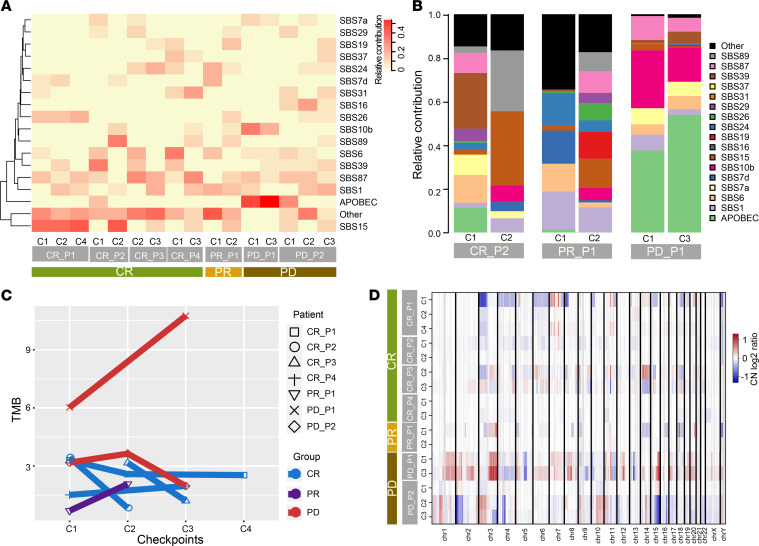
Figure 3. Characteristics of temporal genomic heterogeneity.
(A) Mutation signatures detected in each ESCC sample. (B) Changes in relative mutation signature contribution between pretreatment and treatment stages in CR_P2, PR_P1, and PD_P1. (C) Changes in mutation burden in 3 groups during treatments. (D) SCNA profiles of amplifications (red) and deletions (blue) based on log2 ratio of copy number. Tumor samples are arranged in rows and columns represent genomic positions.

