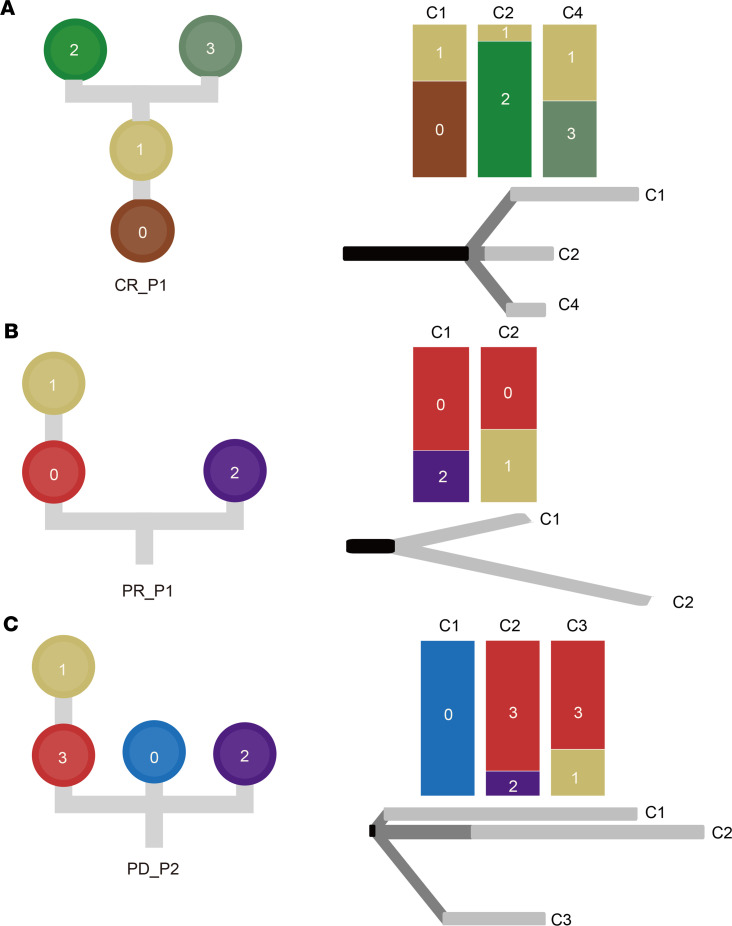
Figure 4. Heterogeneity of clonal evolutions under combined therapies.
Phylogenetic trees show the evolution of clone or subclone at the left side of each panel. The top right of each panel demonstrates the dynamics of clonal composition at each checkpoint across every sample under selective pressures. A discrete-characters parsimony method was used to generate phylogenetic relations based on somatic mutations and copy number aberrations and is shown at the bottom right of each panel. Black: trunk, dark gray: shared branches, gray: private branches. Diverse evolutionary paths were inferred across patients: (A) linear evolution (CR_P1), (B) unrooted branching evolution (PR_P1), and (C) divergent evolution (PD_P2).

