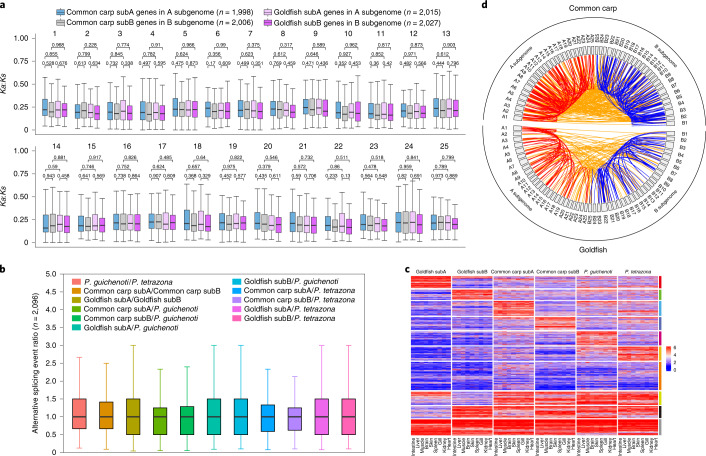
Fig. 3. Purifying selection and splicing pattern of the tetraploid homoeologs.
a, Boxplots of the Ka:Ks ratio distribution of homoeologs from 2,096 septuplets in each tetraploid (except the genes in the scaffolds or having no Ka:Ks ratios). The blue, gray, pink and purple boxplots indicate Ka:Ks distributions from the common-carp-hosted subA genes in the A subgenome, common-carp-hosted subB genes in the B subgenome, goldfish-hosted subA genes in the A subgenome and goldfish-hosted subB genes in the B subgenome, respectively. The P. guichenoti orthologs were served as references. The boxplots show the 25th, 50th and 75th percentiles; the upper and lower whiskers correspond to the third quartile + 1.5× the interquartile ratio and the first quartile + 1.5× the interquartile ratio, respectively. The P values were calculated using the two-sided Mann–Whitney U-test. The n values in the brackets represent the gene numbers of four types on the chromosomes. b, The distribution of AS ratios of 2,096 pairs (listed in the brackets) between two compared genomes. The definitions of the boxplots and whiskers were the same as those in a. c, Heatmap of 2,096 sextuplets, clustered into 10 groups based on the AS number. The color bar at the right indicates the different clusters. d, Circos plot distribution of all TS events in two tetraploid genomes. Red lines and blue lines represent intra-A subgenome and intra-B subgenome TS events, respectively. Orange lines join two separate mRNAs from the A and B subgenomes.

