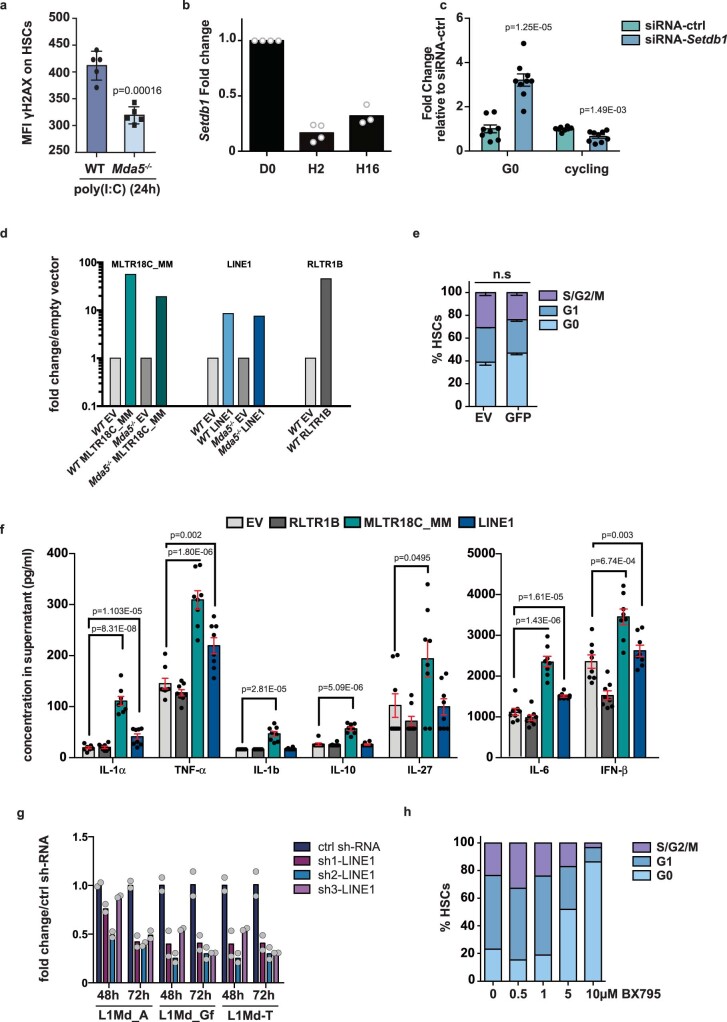
Extended Data Fig. 6. TE expression affects HSC cell cycle.
a, Bar chart depicting the median fluorescence intensity (MFI) of γH2AX signal of WT or Mda5-/- HSCs 24 h after poly(I:C) injection (n = 5 biologically independent samples, mean±s.d., two-tailed t-test). b, RT-qPCR analysis of WT HSCs at D0, H2 and H16 after 5-FU injection for Setdb1 (n = 4 biologically independent samples for D0 and H2, n = 3 for H16 biologically independent samples in two independent experiments). c, Cell cycle analysis of WT HSCs after transfection of control or Setdb1 siRNA (n = 8 biologically independent samples for control siRNA and n = 9 for si-Setdb1 in two independent experiments, two-tailed t-test, mean + /-s.d). d, qRT-PCR analysis of HSCs 20 h after transfection with empty vector (EV), or both strands of the indicated TE copies in WT or Mda5-/- HSCs (n = 2 biologically independent samples). e, Cell cycle analysis of WT HSCs transfected with empty vector (EV) or the vector expressing GFP (n = 2 for EV and n = 3 for GFP biologically independent samples, two-tailed t-test, mean-s.d, n.s. non-significant). f, Measurement of secreted cytokines in supernatant of WT HSCs transfected as indicated (n = 8 biologically independent samples, 2 independent experiments, mean ± s.e.m, two-tailed t-test) g, qRT-PCR analysis of LSK cells 48 h or 72 h after knock-down of LINE1 families (n = 2 biologically independent samples). h, Cell cycle analysis of WT HSCs 48 hours after culture in presence of the indicated concentration of TBK1 inhibitor (BX795) (n = 2 biologically independent samples).

