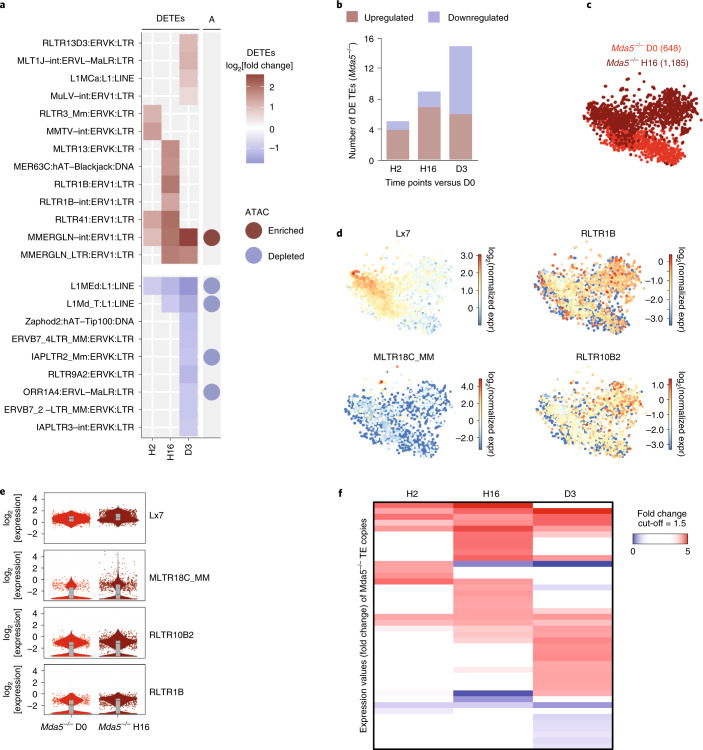
Fig. 4. TE upregulation in Mda5−/− HSCs after chemotherapy.
a, Heat map of the log2-transformed fold change of all differentially expressed TE families detected in Mda5−/− HSCs at the indicated time points after 5-FU treatment. TE families that had a significantly enriched or depleted ATAC-seq peak nearby (±1 kb) are highlighted in the right column (A). b, The number of upregulated or downregulated TE families in Mda5−/− HSCs at the indicated time points after 5-FU treatment. c, t-SNE representation of sorted Mda5−/− HSCs (LSK/SLAM) at D0 (red) and H16 (dark red) (the number of sequenced cells is indicated in parentheses). d, t-SNE representation showing the expression of differentially expressed TE families between H16 and D0 in Mda5−/− HSCs. The colour scale represents the log2-transformed normalized transcript counts. e, The log2-transformed fold change in expression of the TE families shown in d at D0 or H16 in Mda5−/− HSCs from c. The box shows the interquartile range, the whiskers show the minimum and maximum values, and the horizontal line shows the median value. Each dot represents a single cell and the shape of the plot represents probability density. n = 648 (D0) and n = 1,185 (H16) Mda5−/− cells. One independent experiment per time point. Padj < 0.05. f, Heat map of the expression values (fold change) of TE copies in Mda5−/− HSCs at the indicated time points compared to D0. Fold change cut-off = 1.5. Padj < 0.05.

