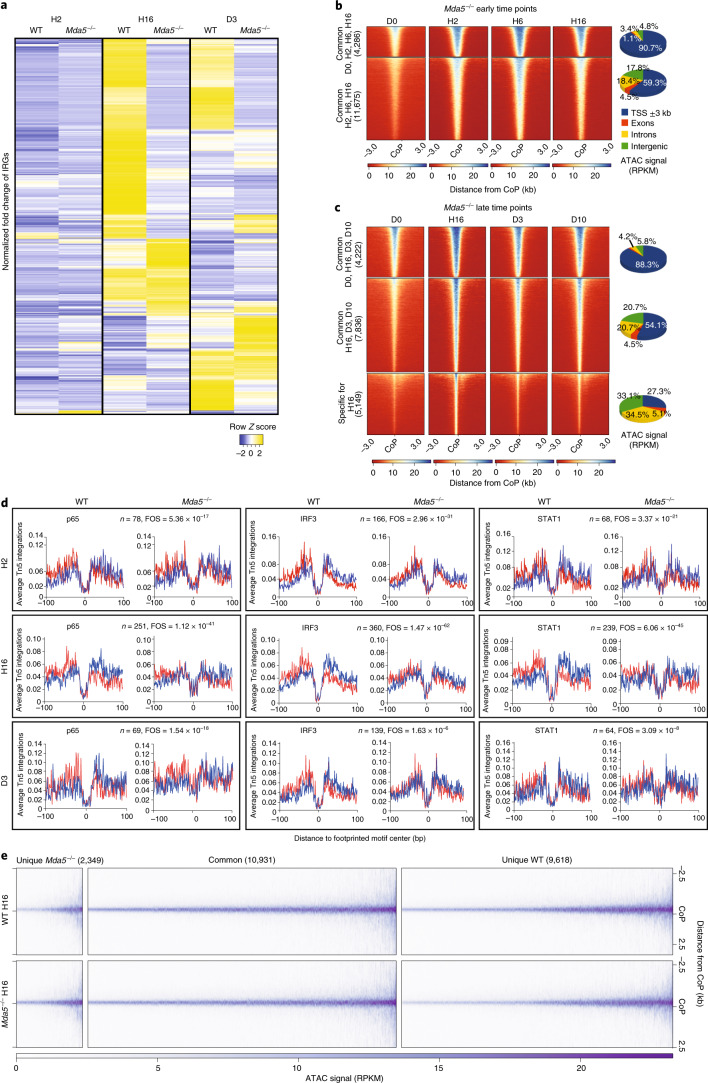
Fig. 5. Impaired inflammatory signalling in Mda5−/− HSCs.
a, Heat map of the normalized fold change in the union of IRGs upregulated in control WT or Mda5−/− HSCs at the H2, H16 or D3 time points compared to D0. Fold change cut-off = 1.5. Padj < 0.05, at least at one time point. b,c, Heat map (left) of the common and differentially accessible regions in Mda5−/− HSCs at D0, H2, H6 and H16 (b) or at D0, H16, D3 and D10 (c) ±3 kb from the centre of the peak. Right, the genomic location distribution of the accessible regions in each cluster of the heat map. d, Average normalized Tn5 insertion profiles around footprinted motifs (p65, IRF3, STAT1) in merged ATAC peaks at the indicated time points after 5-FU treatment in WT or Mda5−/− HSCs. Footprint numbers (n) are indicated at the top. Footprint occupancy scores indicate significance versus D0. Insertions on the forward and reverse DNA strands are indicated in red and blue, respectively. e, Heat map of common and differentially accessible regions in WT and Mda5−/− HSCs at H16.

