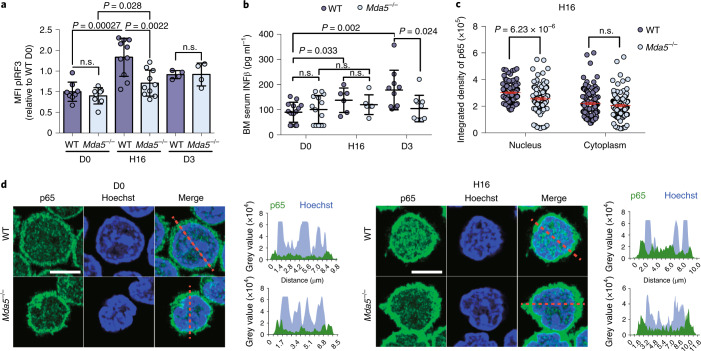
Fig. 6. 5-FU-induced inflammation is MDA5-dependent.
a, Relative changes in median fluorescence intensity (MFI) of phosphorylated IRF3 (pIRF3) in WT or Mda5−/− HSCs at D0, H16 or D3 after 5-FU treatment, normalized to the WT D0. n = 8 biologically independent samples in n = 3 independent experiments (D0), n = 10 biologically independent samples in n = 3 independent experiments (H16) and n = 4 biologically independent samples in one experiment (D3). Each dot represents one mouse. Data are mean ± s.d. Statistical analysis was performed using two-tailed t-tests; n.s. not significant. b, The amount of IFNβ (pg ml−1) measured in the BM serum of WT or Mda5−/− mice at D0, H16 or D3 after 5-FU treatment. Each dot represents one mouse. n = 14 (D0), n = 6 (H16), n = 10 (D3) biologically independent samples in n = 2 (D0 and D3) and n = 1 (H16) independent experiments. Data are mean ± s.d. Statistical analysis was performed using two-tailed t-tests; n.s., not significant. c, The integrated density of the NF-κB subunit p65 in the cytoplasm and the nucleus of WT or Mda5−/− HSCs at H16 after 5-FU treatment. n = 129 (WT) and n = 132 (Mda5−/−) HSCs examined in n = 2 independent experiments. Statistical analysis was performed using two-tailed t-tests; n.s., not significant. d, Immunostaining for NF-κB subunit p65 in WT or Mda5−/− HSCs at D0 and H16 after 5-FU treatment. n = 2 independent experiments. Scale bar, 5 μm. The histograms on the right represent the grey value intensity of both p65 (green) and Hoechst (blue) as indicated in the figure by the red dashed line.

