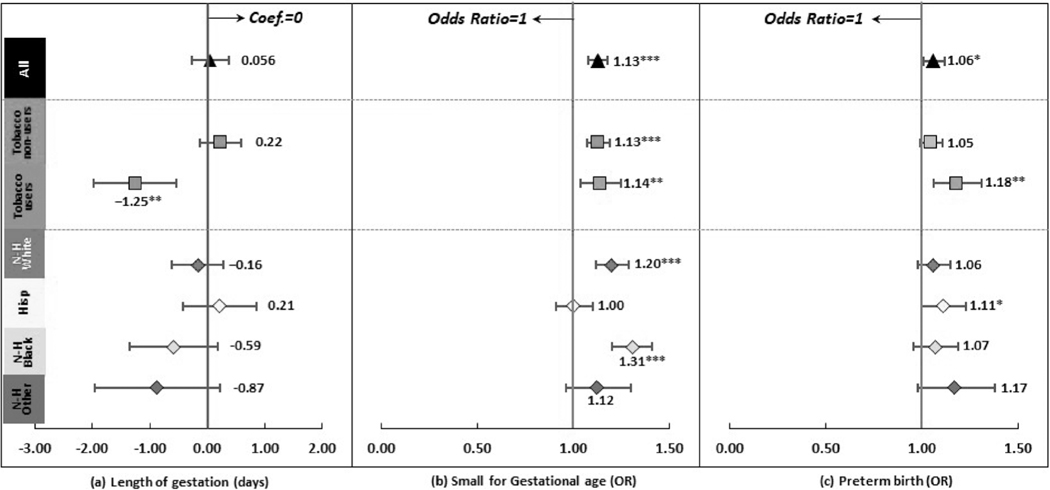
Figure 3.
Regression results after propensity score matching: gestational age related outcomes *P < 0.05, **P < 0.01, ***P < 0.001. ‘Hisp’ short for ‘Hispanic’, ‘N-H’ short for ‘Non-Hispanic’. Dots and lines represent means and 95% confidence intervals for coefficients or odds ratios estimated from generalized linear mixed regressions. Maternal, paternal, and infant characteristics were also included in regressions but not reported. Details are reported in Supporting information Table S6

