
Figure 1. Prevalence of High-Risk HPV by County Poverty.
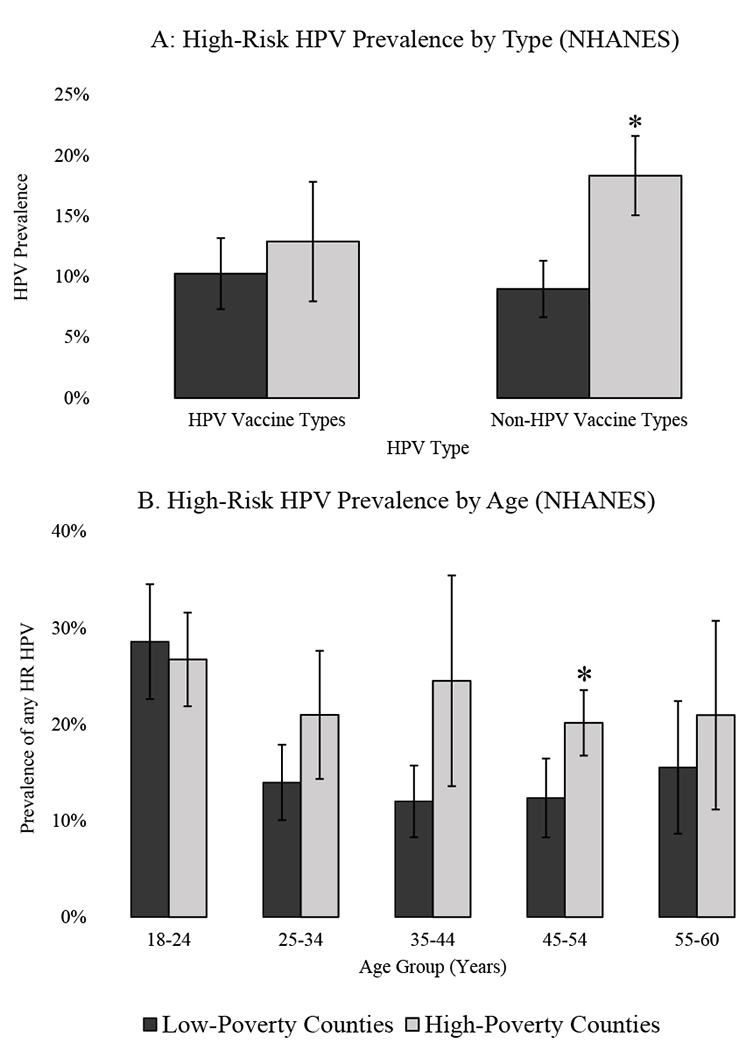
*Different by Wald test comparing high vs. low poverty counties (p <.05) ; Error bars represent 95% confidence interval; Data from National Health and Nutrition Examination Survey 2003-2006. Panel A includes women ages 18-60 by HPV type. Panel B includes prevalence of all high-risk (HR) HPV types by age group