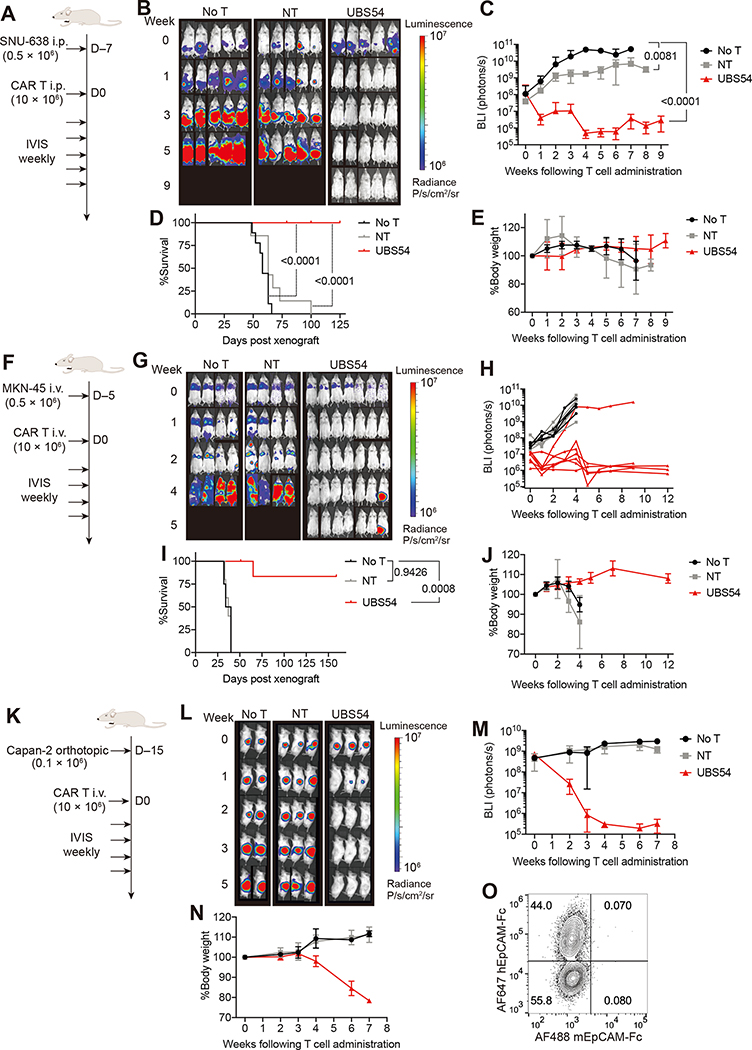
Figure 2. EpCAM-specific CAR T cells mediate complete remission in gastric and pancreatic cancer models.
A, Schematic of the intraperitoneal SNU-638 tumor model. NSG mice were intraperitoneally implanted with 0.5 × 10⁶ SNU-638 cells. 7 days later, mice were either left untreated or treated with NT or UBS54 CAR T cells (10 × 106 cells/mouse) via intraperitoneal injection. B, Bioluminescence images of SNU-638-engrafted NSG mice (n=2 independent experiments). C, Quantitation of total body bioluminescence intensity from the two independent experiments (n=7–9). P values determined by two-way ANOVA with Tukey’s multiple comparisons test. D, Kaplan–Meier survival curves (n=7–9). P values determined by Log-rank (Mantel-Cox) test. E, Summary of body weight changes over time (n=7–9). F, Schematic of the systemic MKN-45 tumor model. 5 days after intravenous inoculation of 0.5 × 10⁶ MKN-45 cells, mice were treated with CAR T cells or control cells (10 × 106 cells/mouse, i.v.) or left untreated. G, Whole-body bioluminescence images of MKN-45-engrafted NSG mice. H, Quantitation of total body bioluminescence intensity. Data are displayed for each individual mouse from No T (n=4), NT (n=5), and UBS54 (n=7) cohorts. I, Kaplan–Meier survival curves. P values determined by Log-rank (Mantel-Cox) test. J, Summary of body weight changes over time (n=4–7). K, Schematic of the orthotopic Capan-2 tumor model. 0.1 × 10⁶ Capan-2 cells were implanted orthotopically into the pancreas, and after 15 days, mice received 10 × 106 NT or UBS54 CAR T cells intravenously. L, Whole-body bioluminescence images of Capan-2-engrafted NSG mice. M, Quantitation of total body bioluminescence intensity (n=2–3). N, Body weight changes over time (n=2–3). O, Jurkat T cells expressing the UBS54 CAR were stained with 100 nM human EpCAM-Fc and 100 nM mouse EpCAM-Fc. For, C, E, J, M, and N: data represent mean±s.d.

