. 2021 Aug 10;20(10):1904–1915. doi: 10.1158/1535-7163.MCT-20-0638

Figure 1.

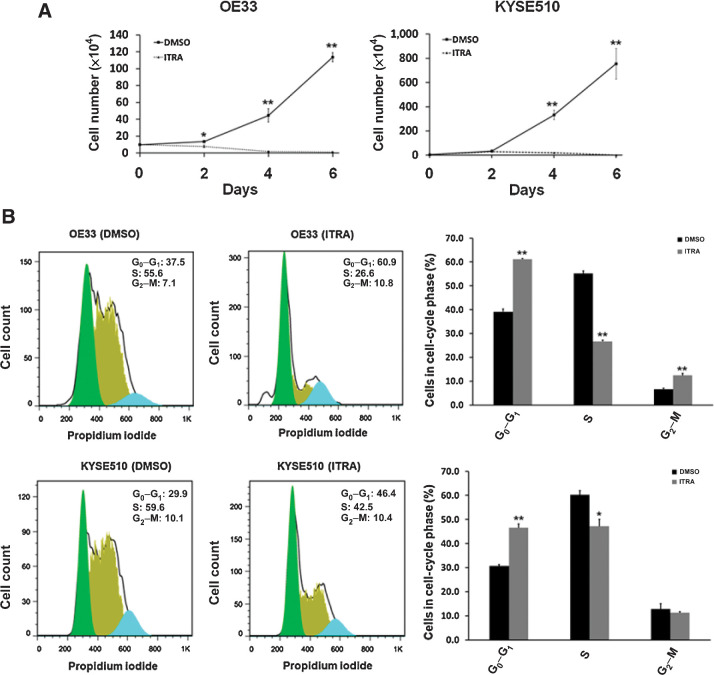
Figure 1. Itraconazole inhibits proliferation of esophageal cancer cells. A, Cell proliferation assay for OE33 and KYSE510 cells. OE33 and KYSE510 cells were plated in 6-well plates and cultured in medium supplemented with 2.5 μmol/L itraconazole or DMSO for 6 days. Cell numbers were measured at the indicated timepoints. Values represent the mean ± SEM for triplicate wells. *, P < 0.05; **, P < 0.01 versus control group by Student t test. B, Representative cell-cycle analysis using flow cytometry after staining with propidium iodide. OE33 and KYSE510 were treated with 2.5 μmol/L of itraconazole or DMSO for 24 hours. Flow cytometric histograms of each phase of the cell cycle in OE33 or KYSE510 cells after itraconazole treatment as compared with control. Values represent the means ± SEM for three replicates. Black bars, DMSO; gray bars, itraconazole. *, P < 0.05; **, P < 0.01 versus control group by Student t test.

Itraconazole inhibits proliferation of esophageal cancer cells. A, Cell proliferation assay for OE33 and KYSE510 cells. OE33 and KYSE510 cells were plated in 6-well plates and cultured in medium supplemented with 2.5 μmol/L itraconazole or DMSO for 6 days. Cell numbers were measured at the indicated timepoints. Values represent the mean ± SEM for triplicate wells. *, P < 0.05; **, P < 0.01 versus control group by Student t test. B, Representative cell-cycle analysis using flow cytometry after staining with propidium iodide. OE33 and KYSE510 were treated with 2.5 μmol/L of itraconazole or DMSO for 24 hours. Flow cytometric histograms of each phase of the cell cycle in OE33 or KYSE510 cells after itraconazole treatment as compared with control. Values represent the means ± SEM for three replicates. Black bars, DMSO; gray bars, itraconazole. *, P < 0.05; **, P < 0.01 versus control group by Student t test.