
Figure 5:
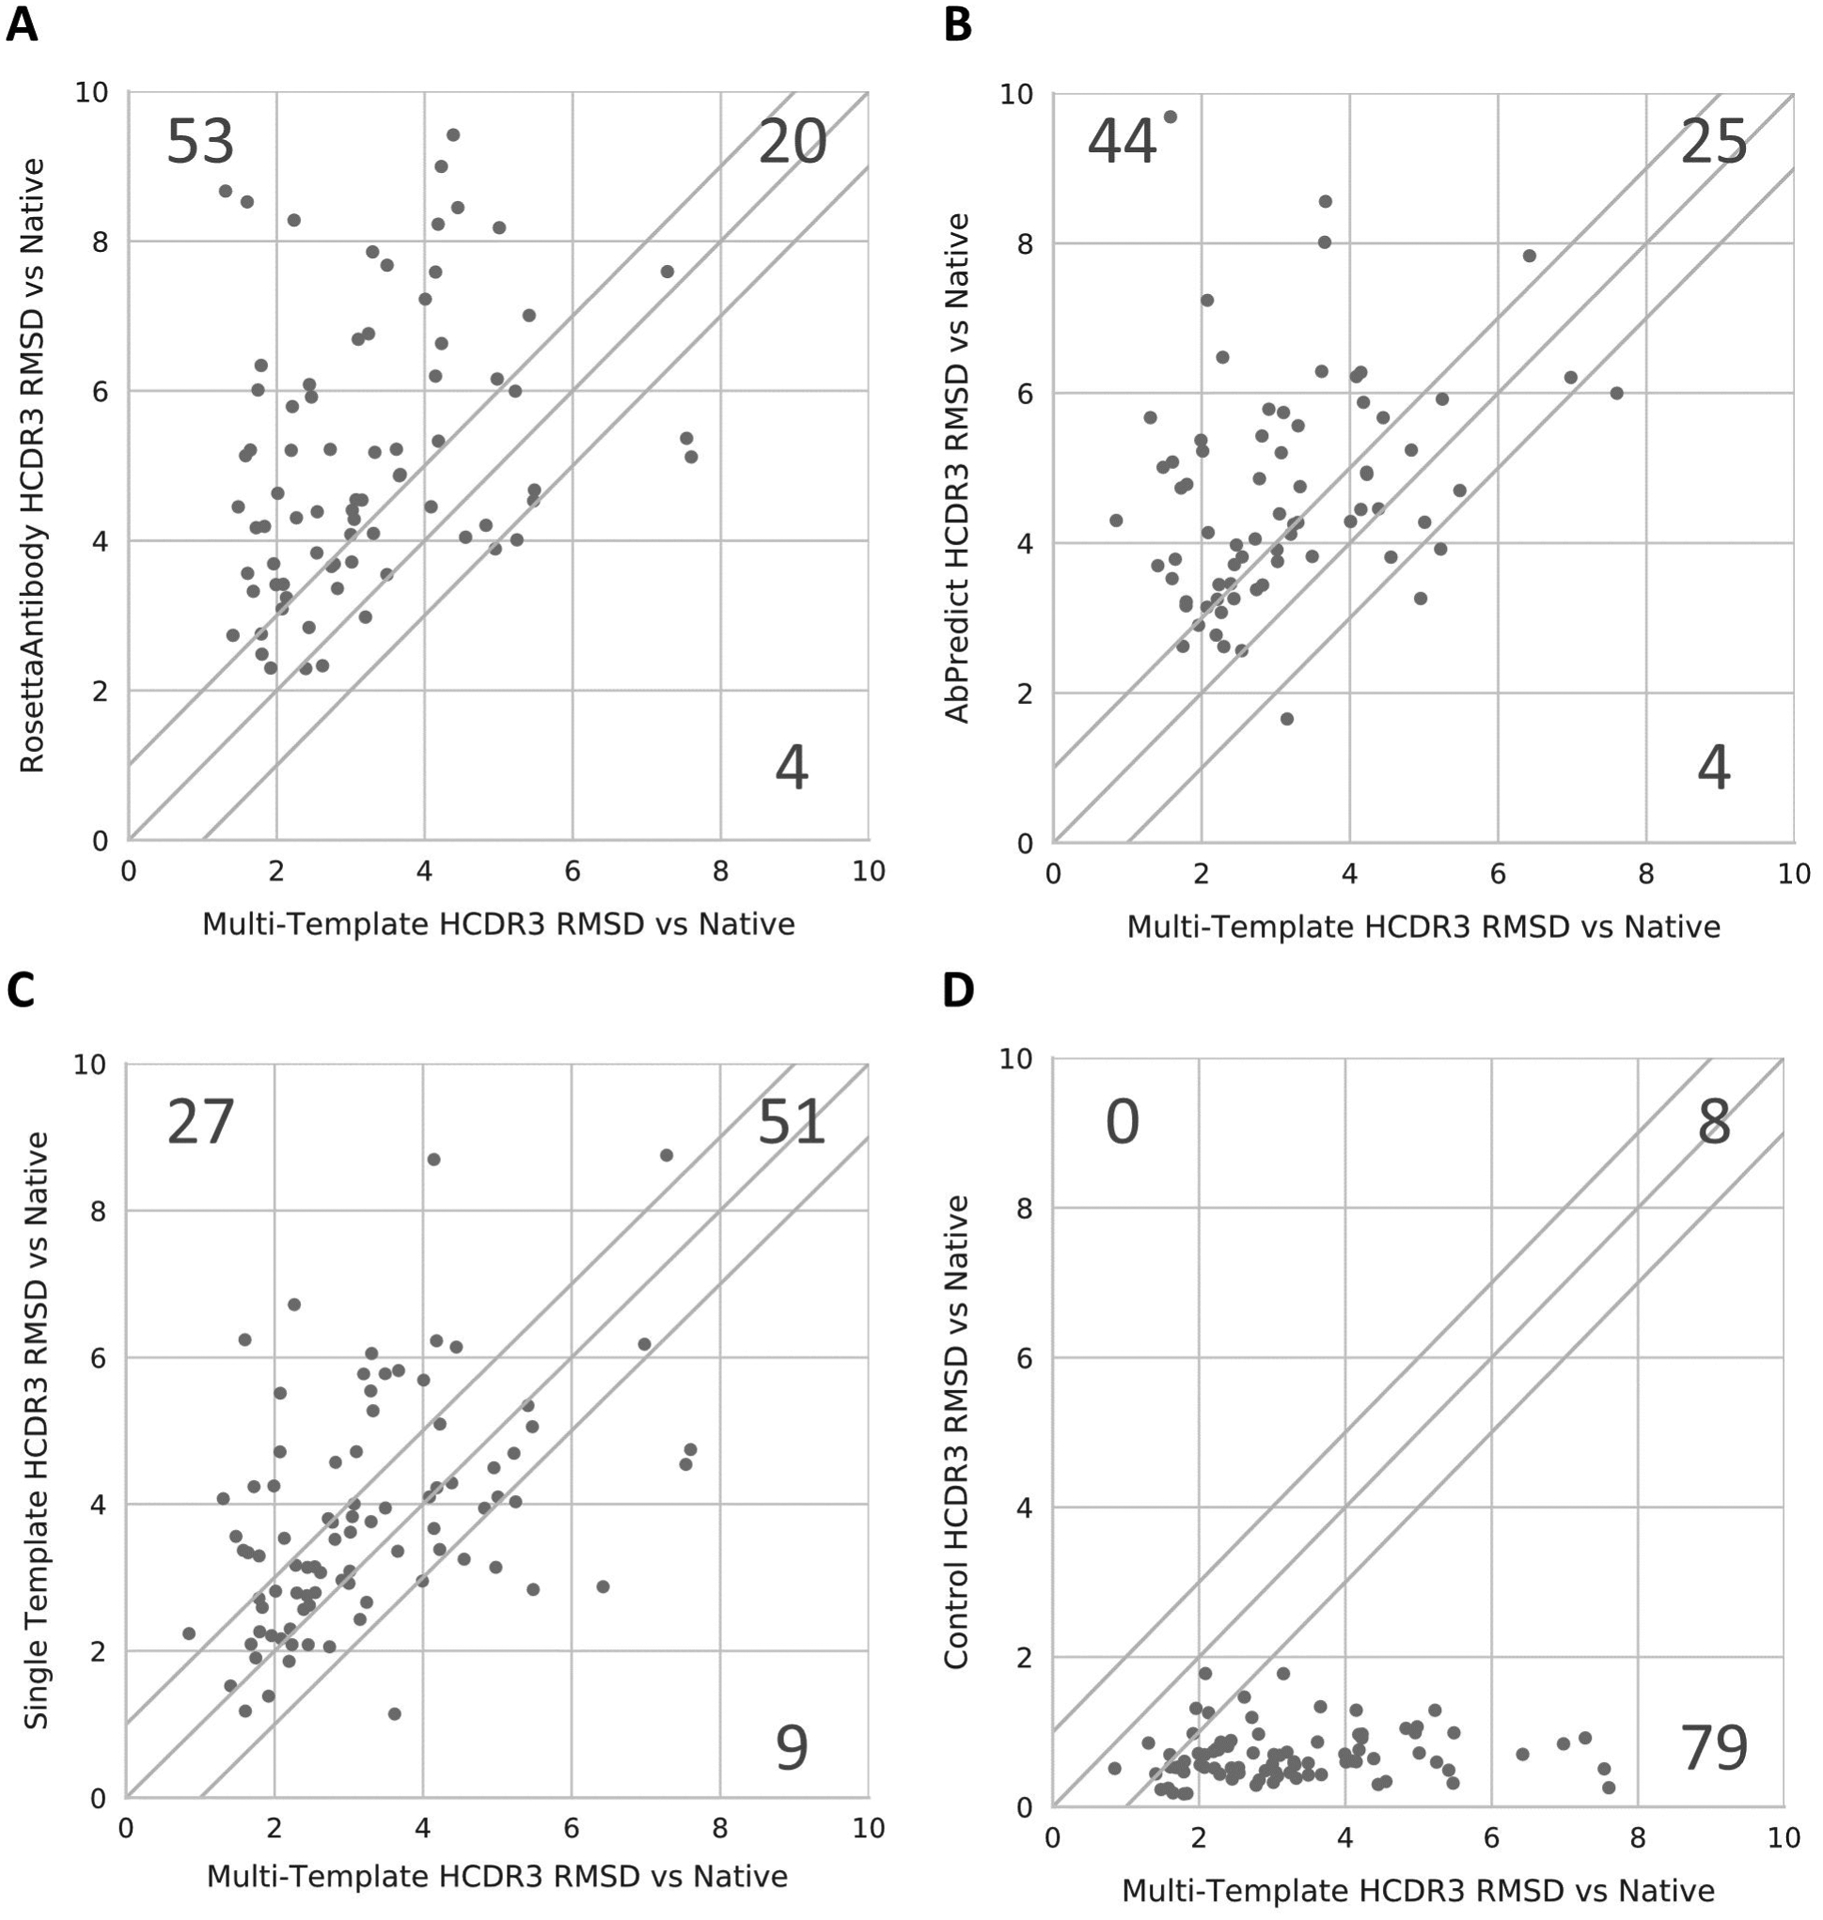
Comparison of antibody HCDR3 modeling performance for the best models produced by each method to the best multi-template models. The performance of RosettaAntibody (A), AbPredict (B), Single Template (C), and our control method (D) were each individually compared to our multi-template method by graphing that method’s median RMSD against our multi-template method’s median RMSD for each antibody. Each chart has a line at y=x representing equal performance between methods. Points above the line represent cases where our multi-template method outperformed another method, whereas points below the line represent the opposite case.