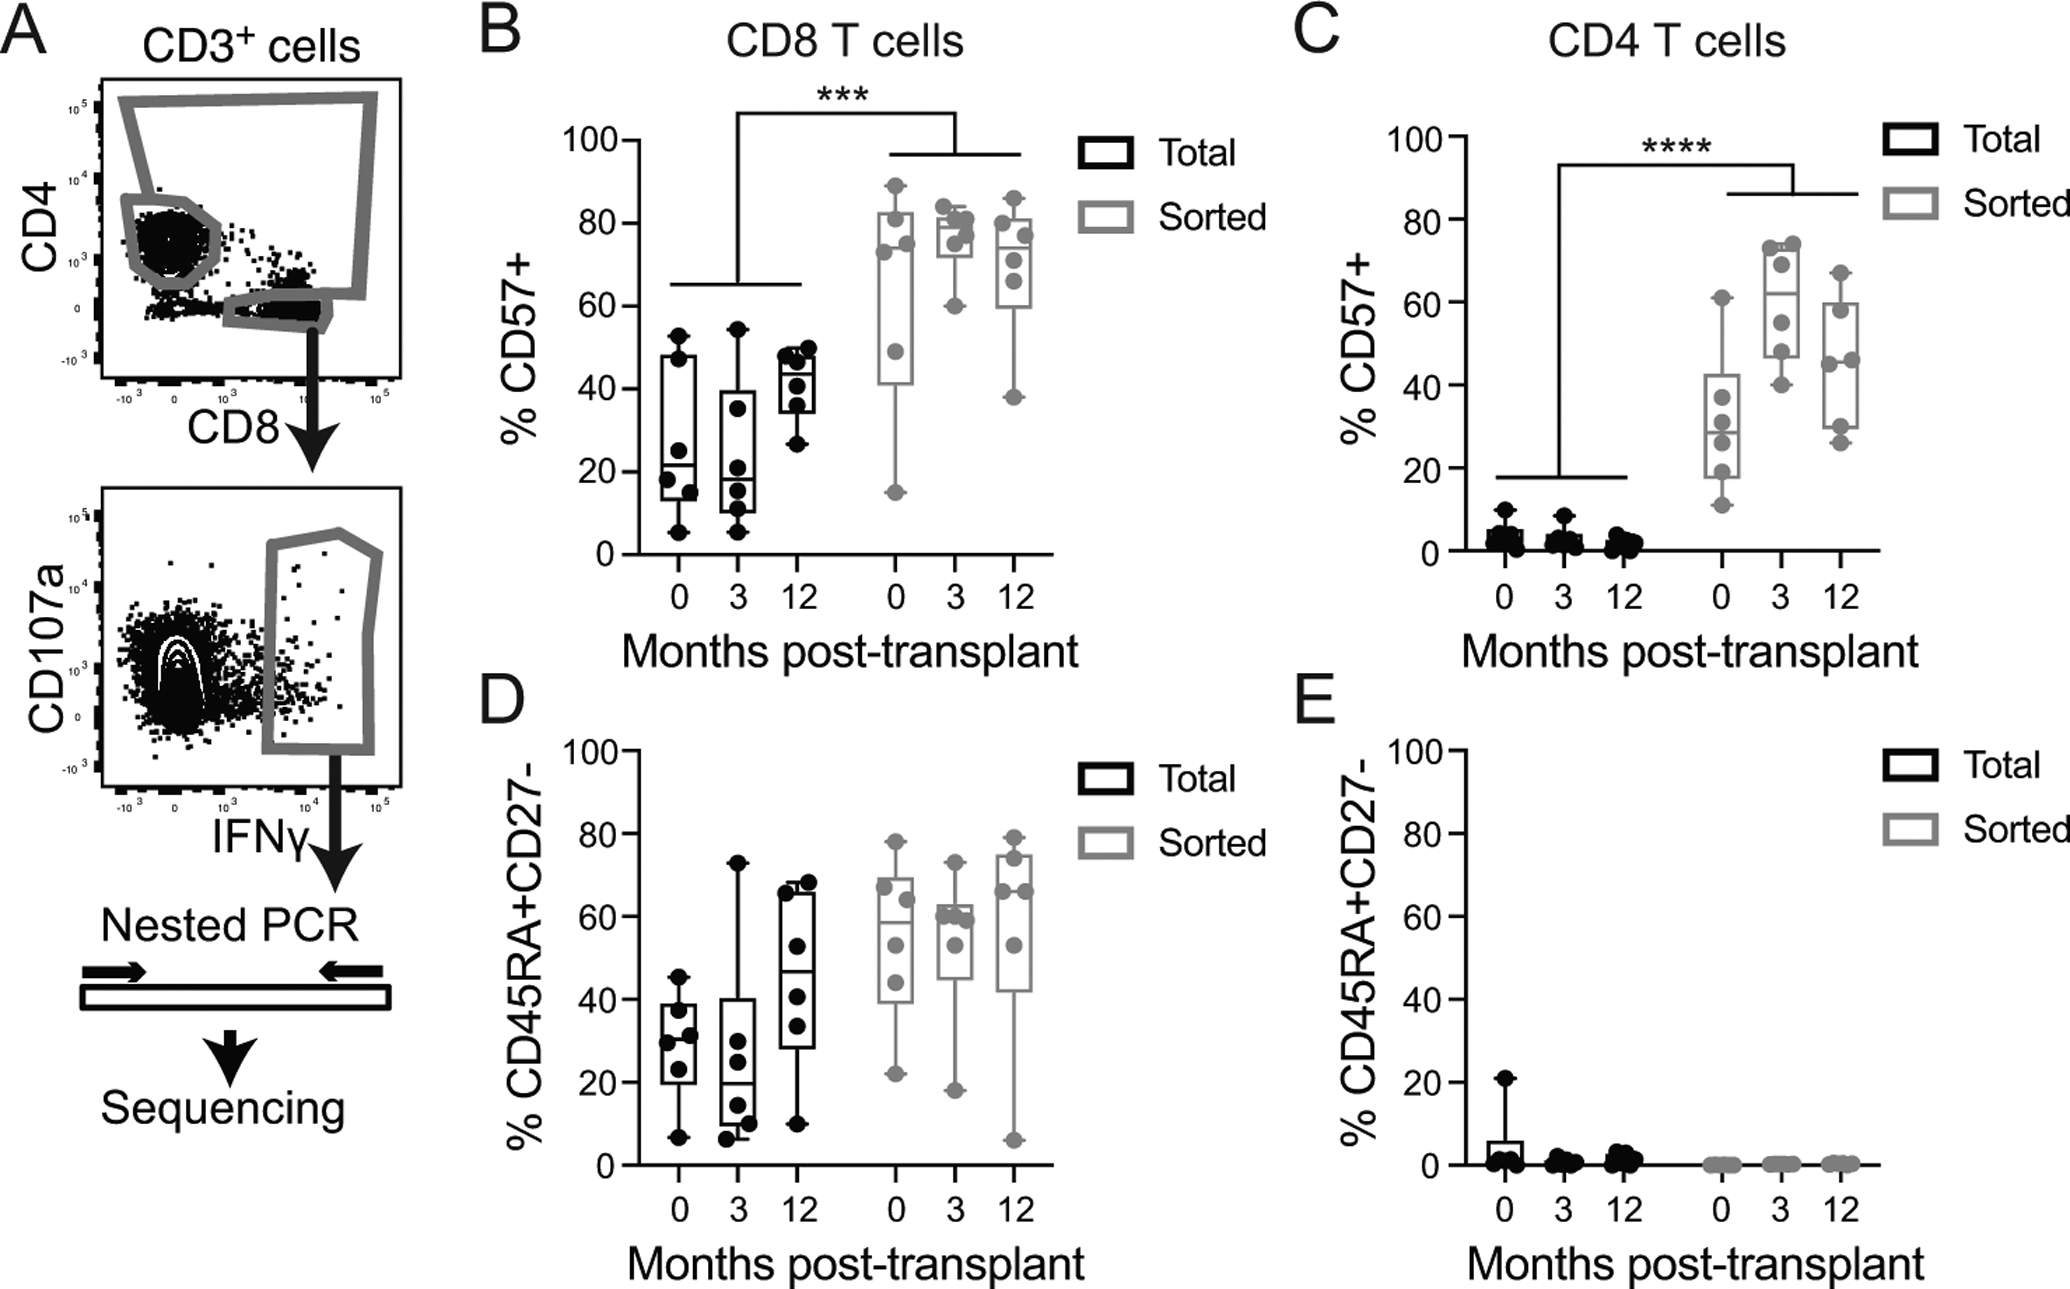
Figure 1: Enrichment of differentiated phenotype in CMV-IE-1 responsive cells:

A) PBMC were stimulated with IE-1 peptide for 5 hours, stained for IFNγ capture and index sorted. Gates were on live singlet lymphocytes, CD3+ and CD14−CD16−CD19−, and as shown. TCR and other genes were amplified and sequenced. Protein expression data analyzed to identify the frequency of aged (CD57+, B and C) and TEMRA (CD45RA+CD27−, D and E) in total and sorted CD8 (B and D) and CD4 (C and E) T cells. Graphs include individual data points and box plot showing median and interquartile range. Statistics computed with two-way ANOVA with Sidak’s correction for multiple comparisons. *** represents p<0.001, **** represents p<0.0001. n=6 subjects.
