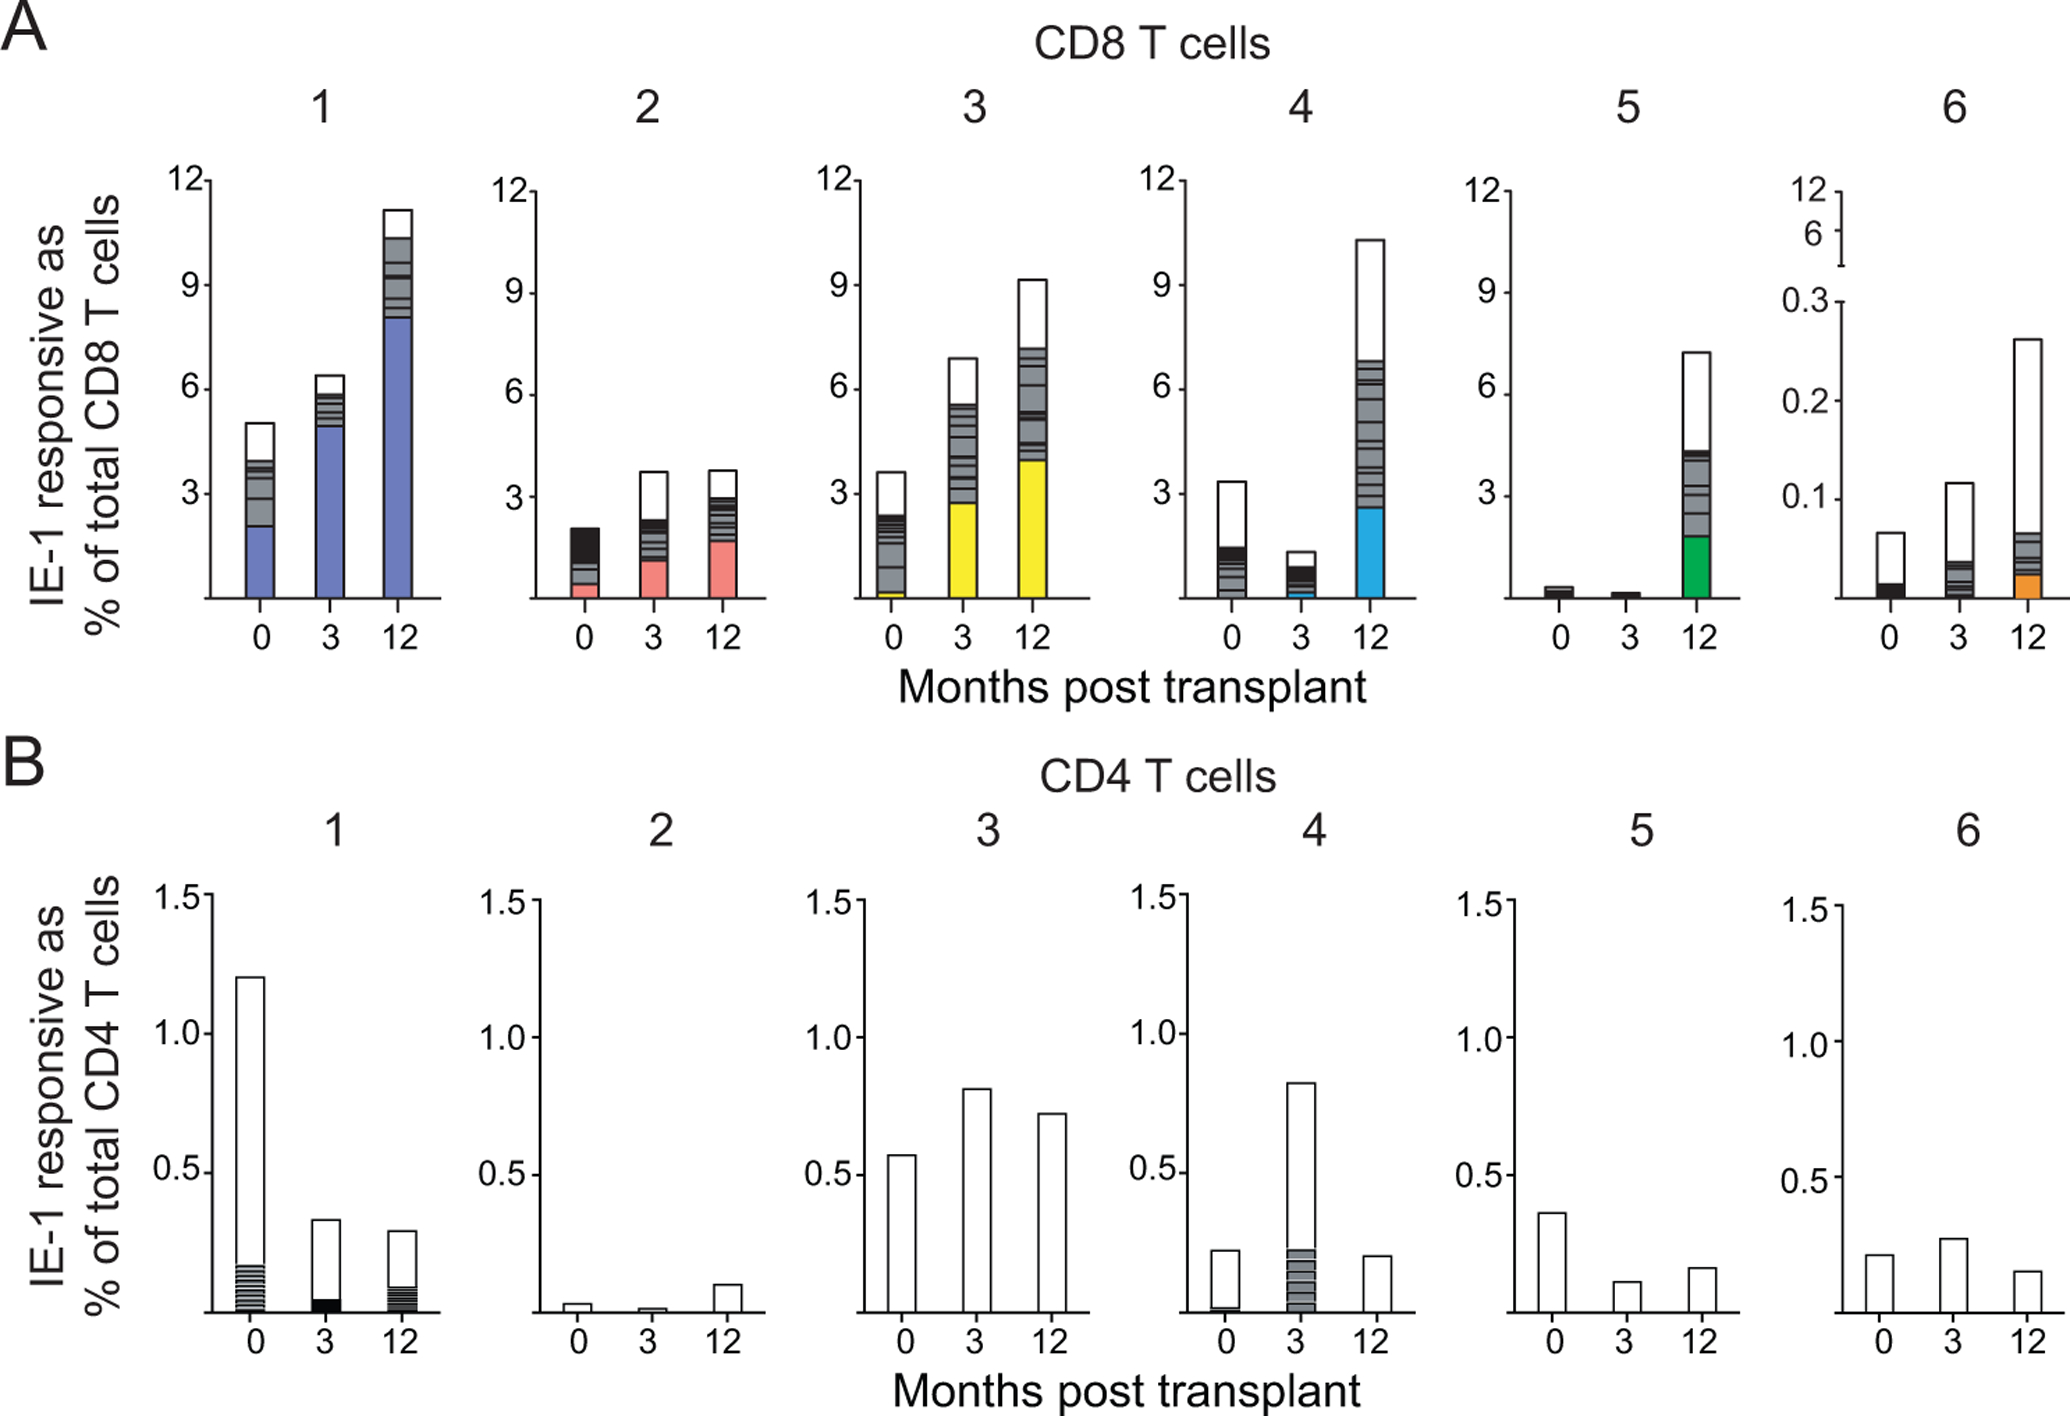
Figure 3: Expansion of IE-1 responsive CD8 T cells dominated by expanded clones:

Clonality of A) CD8 or B) CD4 T cells measured pre- and three and twelve months post-transplant back-calculated as frequency of total A) CD8 or B) CD4 T cells based on % IFNγ+ in ICS data previously described (16). Each column is subdivided by the proportion of individual clones. The largest CD8 T cell clone at 12 months is colored and shown in that color for each time point for that subject. White = clones <2% of sample, gray = clones ≥2% of sample. n=6 subjects.
