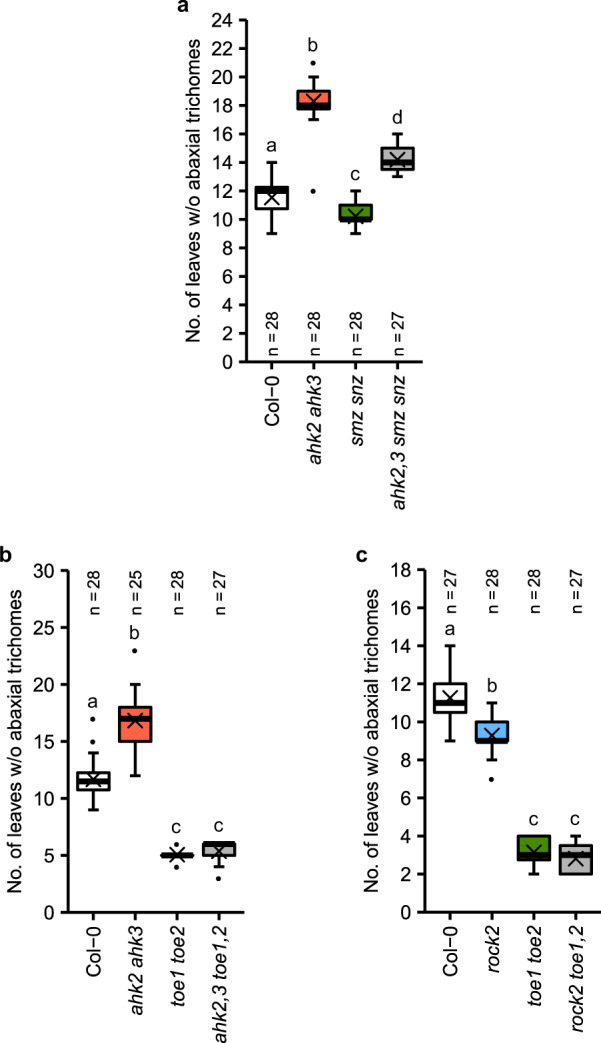
Fig. 6. Genetic interactions between AP2-like genes and cytokinin receptor genes regarding vegetative phase change.

Number of leaves without abaxial trichomes in ahk2,3 smz snz (a), ahk2,3 toe1,2 (b) and rock2 toe1,2 (c) hybrid plants grown in SD. In box plots, the center line represents the median value and the boundaries indicate the 25th percentile (upper) and the 75th percentile (lower). The X marks the mean value. Whiskers extend to the largest and smallest value, excluding outliers which are shown as dots. Letters indicate significant differences between the genotypes, as calculated by Kruskal–Wallis test (q < 0.05). Exact q-values are included in the Source Data files.
