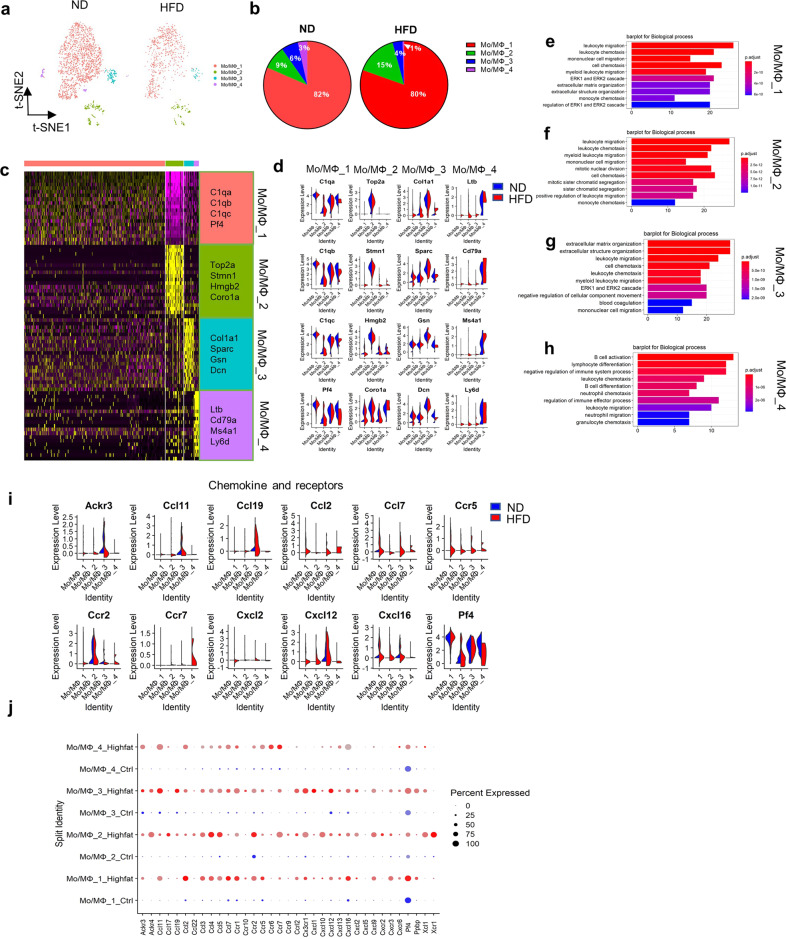
Fig. 4. Comparison of monocyte/macrophage (Mo/MΦ) subpopulations in ascending aortas from ND and HFD mice.
a t-SNE plots of the Mo/MΦ subpopulations (Mo/MΦ_1, Mo/MΦ_2, Mo/MΦ_3, Mo/MΦ_4) from the ND (1991 cells) and HFD (731 cells) groups. b Percentages of Mo/MΦ subpopulations from the ND (Mo/MΦ_1, 82%; Mo/MΦ_2, 9%; Mo/MΦ_3, 6%; and Mo/MΦ_4, 3%) and HFD (Mo/MΦ_1, 80%; Mo/MΦ_2, 15%; Mo/MΦ_3, 4%; and Mo/MΦ_4, 1%) groups. c Heatmap of the top 20 marker genes per subpopulation. d Violin plots of signature genes confirming the subpopulation identities. e–h Top 10 pathways associated with the Mo/MΦ_1 (e), Mo/MΦ_2 (f), Mo/MΦ_3 (g), and Mo/MΦ_4 (h) clusters. i Violin plots of the differential expression of chemokine- and receptor-associated genes by Mo/MΦ subpopulation. j Expression of chemokine- and receptor-associated genes for Mo/MΦ subpopulations as visualized by dot plot.

