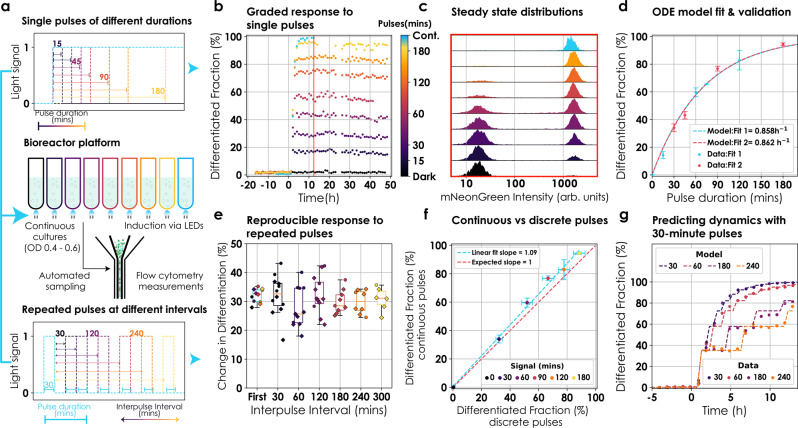
Fig. 2. Characterization and modelling in continuous cultures.
a Bioreactor platform and induction profiles. Cells were cultured continuously in the exponential phase using our bioreactor platform28. Cultures were induced via LEDs and flow cytometry measurements were automated. Induction was in the form of either single pulses of different durations (top) or repeated pulses of 30 min at different interpulse intervals (bottom; only the first two pulses are represented). b Differentiation dynamics after single pulse induction. Cultures were induced at t = 0 with single pulses of light ranging between 15 and 180 min (colour bar). Following induction, cultures were kept in the dark for 48 h. Circles represent values from a unique experiment. c Tunable population composition. Snapshots of population mNeonGreen fluorescence after induction with single pulses (b red line indicates the time of each snapshot). d Model fitting and validation. An ODE model was fitted to single pulse induction data. Circles represent mean steady-state differentiation fractions of three independent experiments (except 75-min pulse, unique experiment). Error bars signify s.d. Blue and red circles were independently used to fit the ODE model (dashed lines). e Reproducible behaviour with repeated pulses. Cultures were stimulated with 30-min pulses repeated at different interpulse intervals (30–300 min). Circles and diamonds represent the change in differentiation fraction by individual pulses from two independent experiments. Data were collated over the two experiments for boxplots. The colour of circles and boxplots reflects interpulse interval. The first pulse of each experiment was used for the blue boxplot. Lines, boxes, and whiskers denote median, quartiles, and extreme values, respectively. f No observable memory effect. Data from (d and e) were used to the compare the efficiency of continuous light vs discrete pulses. Circles represent differentiation effected by continuous pulses (y axis) and equivalent duration of induction in form of 30-min pulses (x-axis). Data are presented as mean values ± s.d.; n = 12 for discrete pulses and n = 3 for continuous pulses, where n is the number of pulses delivered. A linear fit of the data is given by the blue dashed line and compared to expected linear behaviour in the absence of memory (red line). g Predicting dynamics. Data (circles) from (e) was used to check the predictability of the ODE model (dashed lines). Induction started at t = 0. Model predictions were shifted in time to account for observation delay.

