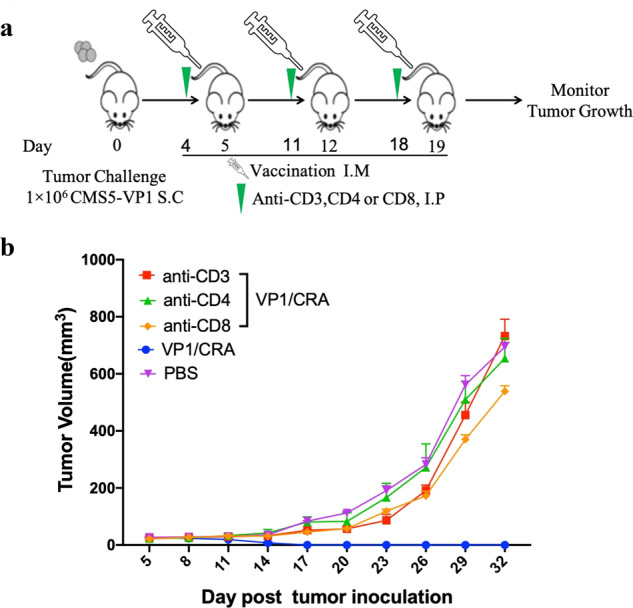
Fig. 5. T cells were the main driver of the antitumor effect induced by VP1/CRA.

The treatment schedule was depicted. Briefly, CMS5-VP1 tumor cells at 1 × 10⁶ per mouse were inoculated into naïve BALB/c mice subcutaneously in the left flank black on day 0. When tumors were palpable, tumor-bearing mice were randomly divided into five mice per group, tumor-bearing mice were intraperitoneally injected with anti-CD3, anti-CD4, or anti-CD8 monoclonal antibodies once a week starting from day 4, followed by the immunization of VP1/CRA in the left hind limp once a week. b Tumors were measured with digital calipers every 3 days and tumor volume was calculated.
