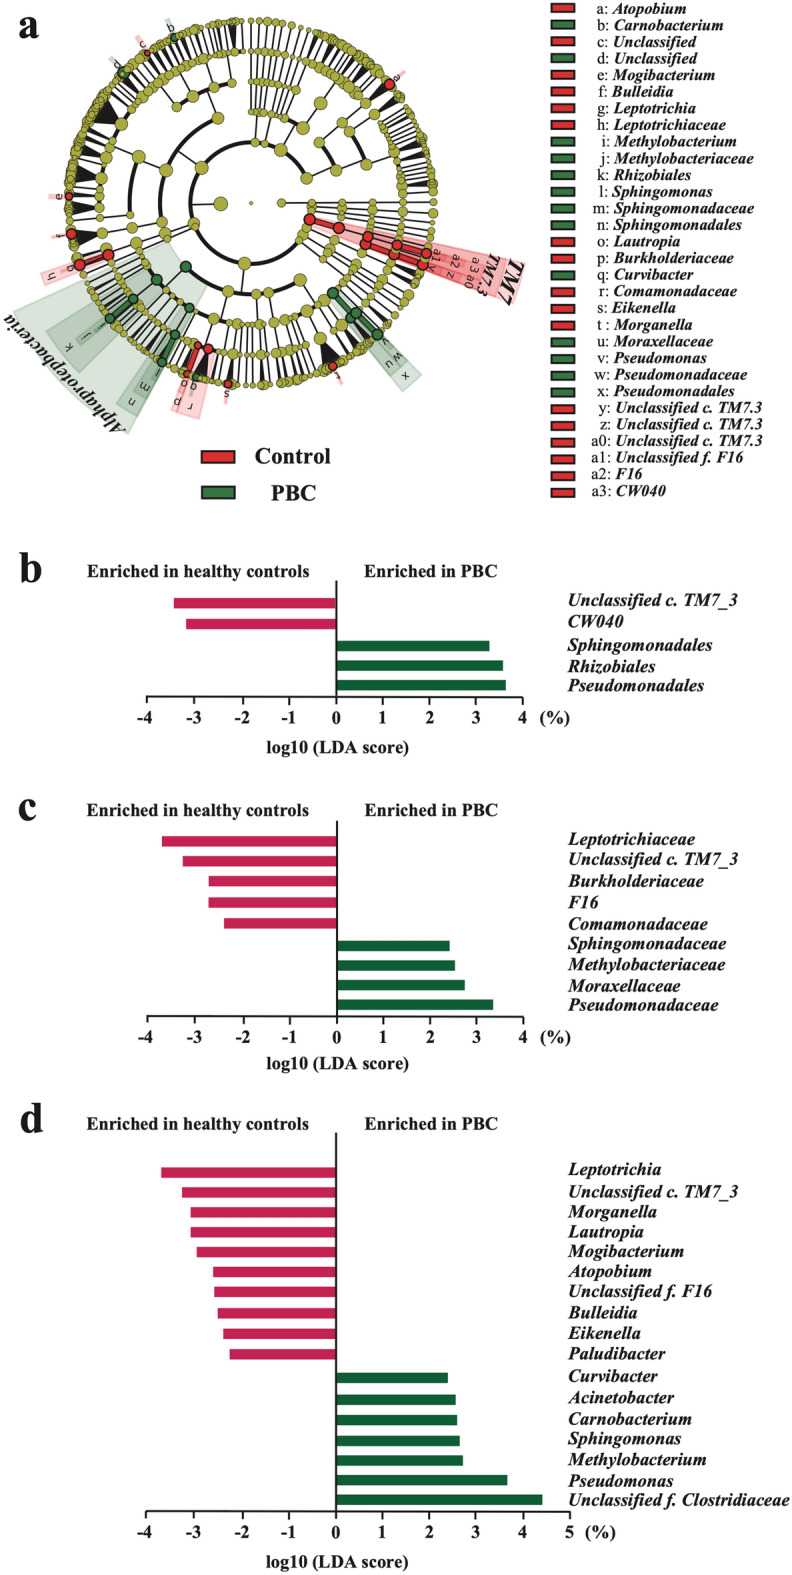
Figure 3.

Changes in gut bacterial taxonomic abundance in patients with PBC (n = 34) compared with HCs (n = 21). (a) Bacterial taxa identified to be rich based on the differences between the groups analyzed by LEfSe (LEfSe v1.0, https//huttenhower.sph.harvard.edu/lefse/) (Logarithmic LDA score > 2.0). Bacterial taxa of the patients with PBC were compared with those of HCs at various levels. Bacterial taxa with high numbers of bacteria in the PBC group are shown in green, and bacterial taxa with high numbers of bacteria in the HC group are shown in red. In addition, the bacterial taxa showing insignificant differences in their abundance between the two groups are shown in yellow. LEfSe identified Alphaproteobacteria as a differentially abundant taxon in the PBC group versus the HC group. (b) Order-level relative abundance of bacteria in the PBC group compared with that in the HC group. (c) Family-level relative abundance of bacteria in the PBC group compared with that in the HC group. (d) Genus-level relative abundance of bacteria in the PBC group compared with that in the HC group. Values are expressed as the median of the interquartile range. PBC, primary biliary cholangitis; HC, healthy control; LEfSe, linear discriminant analysis effect size; LDA, linear discriminant analysis.
