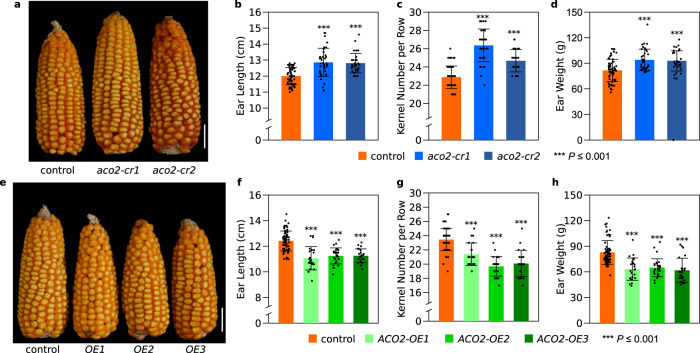
Fig. 3. Validation of ZmACO2 function by coding region knockout and overexpression.
aZmaco2 knockout alleles (aco2-cr1 and aco2-cr2) made longer ears with more kernels than sibling controls; scale bar = 5 cm. Performance of control and Zmaco2 knockout alleles (aco2-cr1 and aco2-cr2) on ear length (b, p = 2.37 × 10⁻⁸ and 1.87 × 10⁻⁹ respectively), kernel number per row (c, p = 6.82 × 10⁻²⁰ and 1.44 × 10⁻⁹ respectively) and ear weight (d, p = 1.41 × 10⁻⁵ and 1.15 × 10⁻⁴ respectively); orange bar, control, n = 64 in (b−d); blue bar, Zmaco2 alleles, n = 36 (aco2-cr1) and 31 (aco2-cr2) in (b−d), respectively. e ZmACO2 overexpression lines made shorter ears with less kernels than sibling non-transgenic controls; scale bar = 5 cm. f−h, Performance of ear length (f, p = 5.79 × 10⁻¹⁰, 1.64 × 10⁻¹⁰ and 2.32 × 10⁻⁹ respectively), kernel number per row (g, p = 3.76 × 10⁻⁷, 1.99 × 10⁻¹⁹ and 2.68 × 10⁻¹³ respectively) and ear weight (h, p = 5.38 × 10⁻⁸, 1.24 × 10⁻⁸ and 1.54 × 10⁻⁸ respectively) in controls and ZmACO2 overexpression lines; orange bar, control, n = 69 in (f−h); green bar, ZmACO2 overexpression line, n = 23 (ACO2-OE1), 29 (ACO2-OE2) and 23 (ACO2-OE3) in (f−h), respectively. For (b−d) and (f−h), data are presented as means ± SD. ***p-value ≤ 0.001, from a two-tailed, two-sample t-test. n is the number of ears examined in (b−d) and (f−h).

