Figure 11.
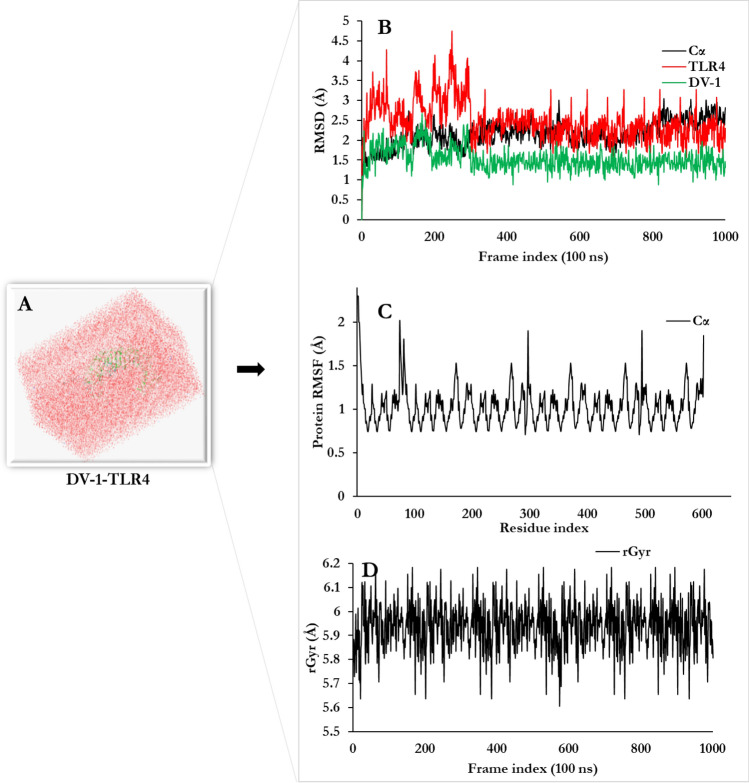
Molecular dynamics simulation of (DV-1-TLR-4 complex at 100 ns (ns). (A) Molecular dynamics trajectory (system set-up for the simulation), (B) Root Mean Square Deviation of docked complex shows very minimal deviation which reflects the stable microscopic interaction between DV1 and TLR4 molecule (C) RMSF-Root Mean Square Fluctuation plot of docked protein complex side chain fluctuation in plot generates peak which reflects the flexibility of side chain of docked protein complex. (D) Time evolution of the radius of gyration (rRyr) during 100 ns of MD simulation.

