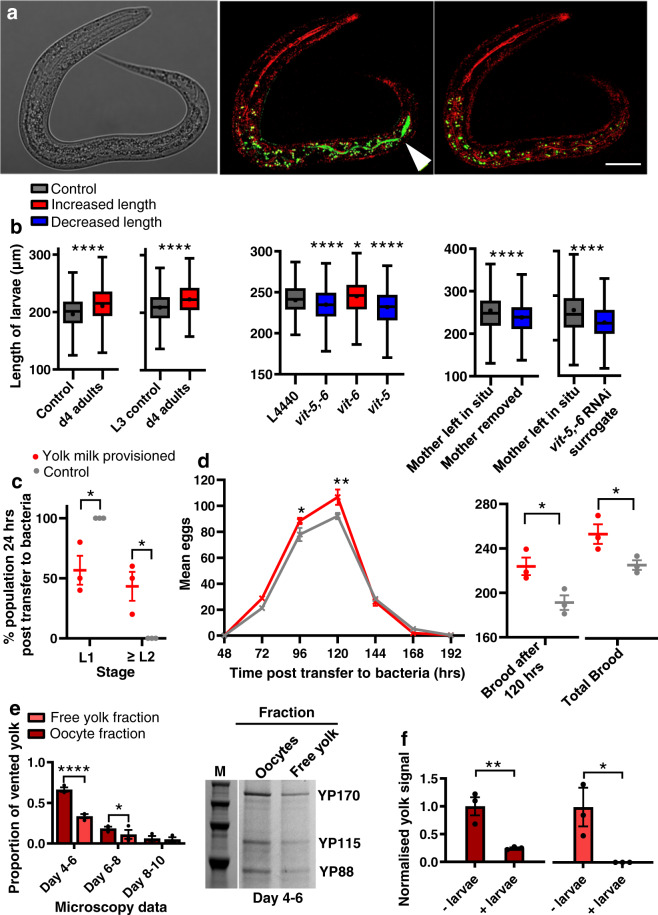
Fig. 2. Vented yolk and unfertilised oocytes support larval growth.
a Yolk in the intestinal lumen of a wild-type L1 larva after being left on a plate with no food apart from vented yolk (VIT-2::GFP labelled) for 4 h. Left: Nomarski microscopy image. Middle: larva imaged immediately after removal from plates using reflectance confocal microscopy (RCM) to highlight the refractive material of the terminal web that surrounds the intestinal lumen (fluorescence filters MBS T80/R20 and 405 nm excitation) (red) and superimposed airyscan image (488 nm excitation) (green) for GFP-labelled yolk. Right: same larva imaged 100 min later showing yolk no longer in the lumen, either due to defaecation or digestion; this disappearance confirms that the green fluorescence indicated in the central panel corresponds to yolk within the intestinal lumen. White arrowhead: VIT-2::GFP. Scale 20 μm. Fluorescence outside intestinal lumen is from gut granule autofluorescence51. For details on RCM, see Supplementary Fig. 2b, c. b Tukey box plots of length measurement of L1 larvae (line at median; + at mean; box limits are 25th and 75th percentiles; whiskers denote 1.5 times the interquartile range). Left and middle: larvae left from the egg stage for 48 h on plates preconditioned with day 4 adults left to vent for 24 h. L4440 empty vector control for RNAi-treated adults. Right: day 3 adults left to lay last few eggs and either left with larvae to vent yolk for 48 h or removed, or replaced with RNAi-treated surrogate mothers. Combined data of 3 trials (n = 200 worms per trial). Non-parametric two-tailed Kolmogorov–Smirnov tests were performed and corrected according to FDR. Left to right for stars P = <0.0001, <0.0001, <0.0001, 0.019, <0.0001, <0.0001, <0.0001. Red: treatments that increase the dependant variable; grey: control; and blue: that reduce the dependant variable. All larvae in trials are wild type. Larval cross-sectional area as well as length is increased following exposure of larvae to plates preconditioned with vented yolk (Supplementary Fig. 2d). c Recovery of larvae to the L2 stage and beyond, 24 h post transfer to bacteria. Two-way ANOVA (Bonferroni’s multiple comparisons test). Left to right for stars P = 0.014, 0.014. d Lifetime reproductive schedule. Left: Two-way ANOVA (Bonferroni’s multiple comparisons test); left to right for stars P = 0.049, 0.003. Right: unpaired two-tailed t-test; left to right for stars P = 0.049, 0.034. c, d Mean ± S.E.M. of 3 trials displayed (n = 10 worms per trial). Red: larvae transferred to bacteria after they were left from the egg stage for 48 h on plates preconditioned with day 4 adults left to vent for 24 h. Grey: control with larvae transferred to bacteria after they were left from the egg stage for 48 h on untreated plates. For data showing larval development on bacteria 48 h post transfer and time of first egg lay see Supplementary Fig. 2e. e Relative levels of free yolk vs yolk in unfertilised oocytes quantitated from VIT-2::GFP fluorescence on plates (n = 10 worms per trial). Data normalised to total yolk on days 4–6. Mean ± S.E.M. of 3 trials displayed. Two-way ANOVA (Bonferroni’s multiple comparisons test). Left to right for stars P = <0.0001, 0.037. Right: Protein gel showing YP bands after yolk collection from plates on d4–6. M: marker. For protein gel data of vented free yolk on all days see Supplementary Fig. 2f. f Larvae consume vitellogenin in both free yolk and oocyte fractions. Quantitated levels of YP170 from plates preconditioned with 100 venting d4 adults for 24 h followed by addition of 200 larvae or no larvae controls for 48 h. Oocytes and free yolk were washed from plates with M9 containing 0.001% NP-40 to solubilise vitellogenin34. Yolk and oocytes were then separated by gentle centrifugation, with the oocytes clearly visible in the pellet fraction. The two fractions were then subjected to protein gel electrophoresis. Data shows S.E.M. of 3 trials normalised to no larvae controls. Unpaired two-tailed t-test. Left to right for stars P = 0.009, 0.046. For protein gel data, see Supplementary Fig. 2g. *P < 0.05, ****P < 0.0001.

