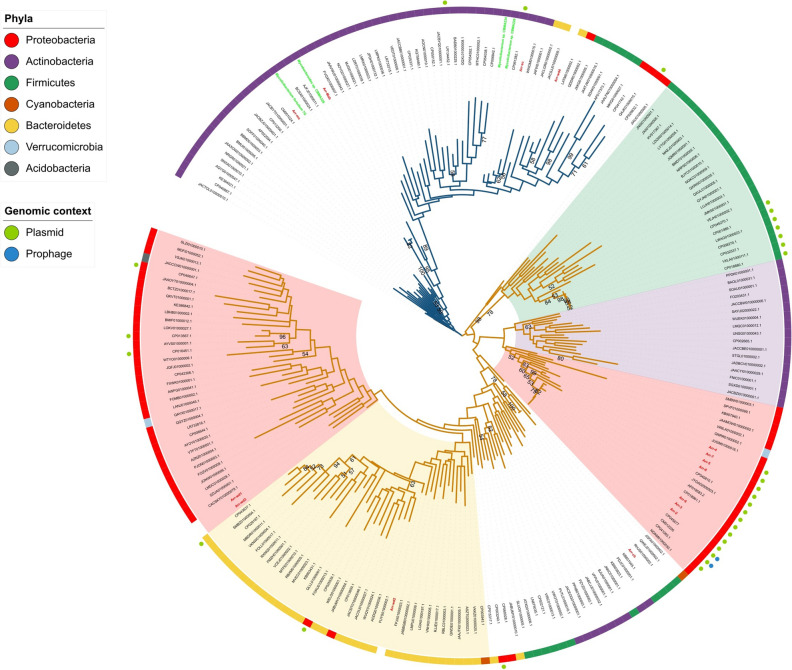
Figure 2.
Arr phylogeny generated by the maximum likelihood method. The blue (clade I) and yellow (clade II) branches denote the two main clades. Some sub-clades of clade II are highlighted. Arr sequences functionally verified by this study and other studies are labeled green and red, respectively. Bootstrap values above 50 are shown. The outer color strips indicate the bacterial phylum of the sequence. The presence of colored circles beside the strips indicates whether the sequence has been identified in a mobile element. Reference sequences are ticked in red and have been functionally characterized.

