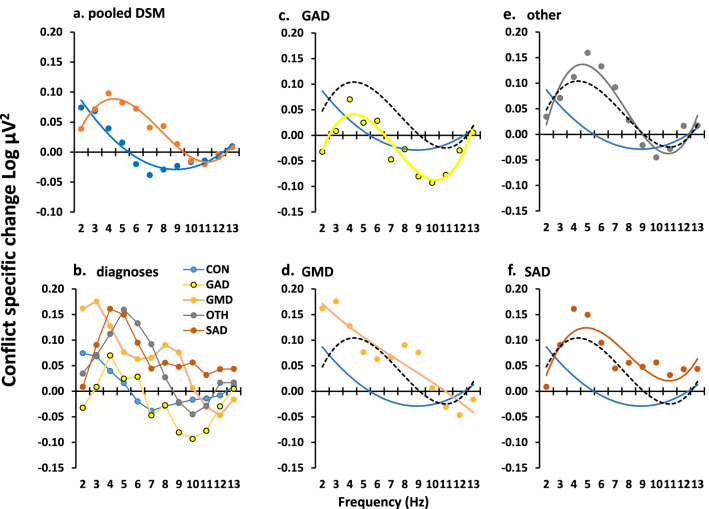
Figure 3.
Variation of GCSR in the community sample. (a) Patients, pooled across diagnosis, showed a peak in the region of 4–5 Hz. However, the difference curve (Fig. 4b) shows that they differed maximally from controls in the region of 6 Hz and the asymmetry of the peak within the analysed range gave rise to the cubic component reported in the main text. Post hoc analysis restricted to 3–10 Hz, to achieve symmetry, resulted in the expected significant quadratic component (compare with 2SE quadratic shown in Fig. 4b). (b) Diagnostic groups overlayed with no trend lines. (c–f) Individual diagnoses with overlaid trendline and similar trendlines for control (blue) and average of diagnosis averages (black, dashed) for comparison. Abbreviations: CON control, GAD generalized anxiety disorder, GMD generalized anxiety with major depression, OTH other anxiety diagnoses (e.g., panic disorder), SAD social anxiety disorder.

