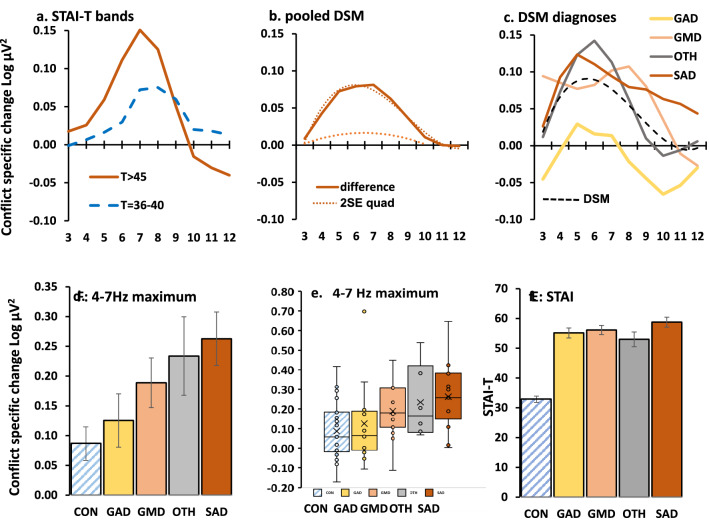
Figure 4.
Clinically relevant differences from control in goal conflict specific EEG power (GCSR, 3-point smoothed after ANOVA) at the right frontal site F8 (F7 for left handers). (a) Power difference for clinical level (T > 45, high GCSR) and subclinical (T = 36–40, modest GCSR) relative to low (T < 33) STAI-T groups. (b) high GCSR in patients relative to controls (largest difference at 6–7 Hz) with (dotted) fitted quadratic and cubic curve detected by ANOVA. The lower dotted curve is 2SE for the quadratic difference in the range 3–10 Hz. (c) Variation in difference from controls with diagnosis. Removal of the control group eliminated significant differences from the ANOVA, with the diagnostic groups sharing a significant cubic trend (dashed line) reflecting a common tendency to peak in the region of 5–6 Hz. (d) Variation across diagnostic groups in group average of individual maximum GCSR in the range 4–7 Hz. The apparent variation in maximum GCSR was not significant after removal of the control group. Bars represent 2SE. (e) Distribution of maximum 4–7 Hz GCSR scores across diagnostic groups. (f) STAI-T did not vary among the clinical diagnoses. Abbreviations: CON control, DSM American Psychiatric Association’s Diagnostic and Statistical Manual-IV, GAD generalized anxiety disorder, GMD generalized anxiety with major depression, OTH other anxiety diagnoses (e.g., panic disorder), SAD social anxiety disorder, STAI Spielberger State Trait Anxiety Inventory, T trait score on STAI.

