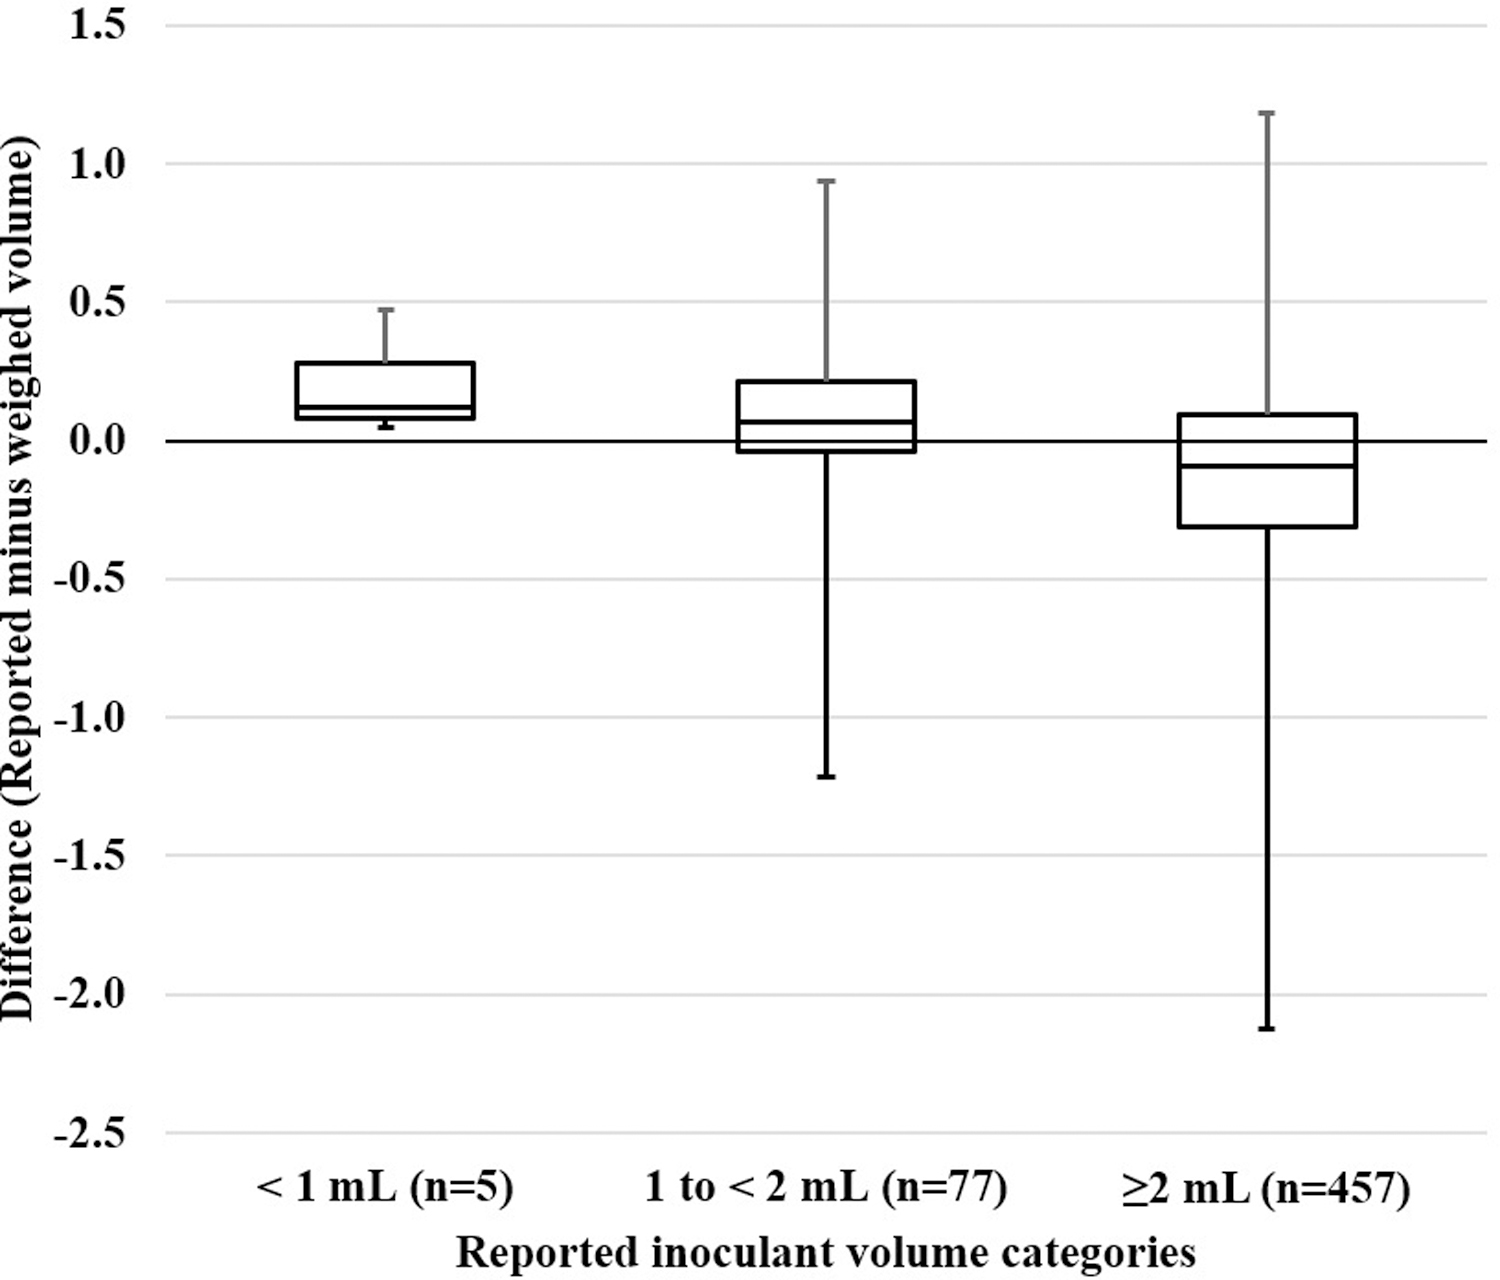
Figure 3:

This box and whisker plot shows the median distribution of difference between reported and weighed inoculant volume across three categories of reported inoculant volume (<1 mL, 1 to <2 mL and 2 or more mL). Median difference greater than zero between reported and weight inoculant when <2 mL was documented suggests reported volumes were more frequently more than weighed volumes. In contrast, among the majority of the cultures (n=457) where 2 or more mL were reported, weighed volume was higher or the same as the reported inoculant volume, giving a median difference less than zero.
