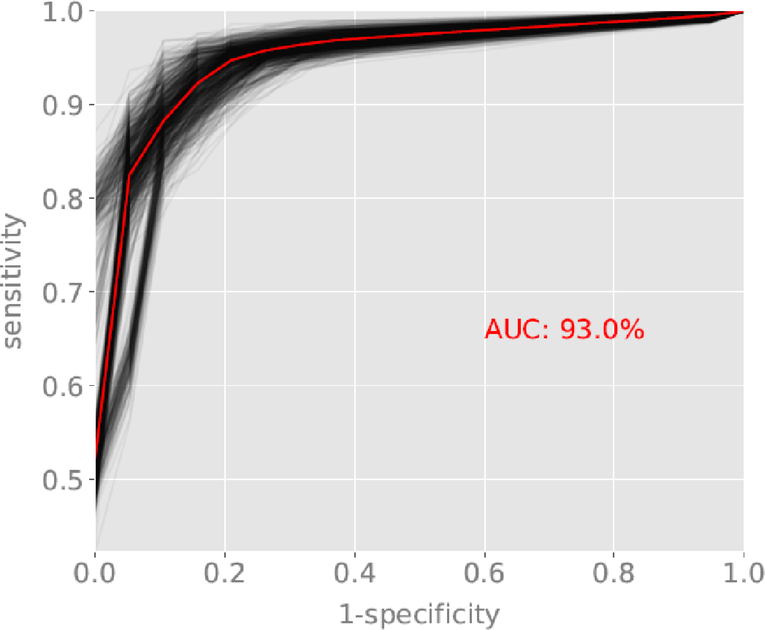
Figure 2a:
ROC curve for the classification of schizophrenia and schizoaffective disorder versus depression and bipolar disorder with psychotic features. Red line reflects the average ROC curve and AUC of 93.0%. Black lines represent sampling of individual ROC curves generated from random splits of the dataset into training and validation subsets.

