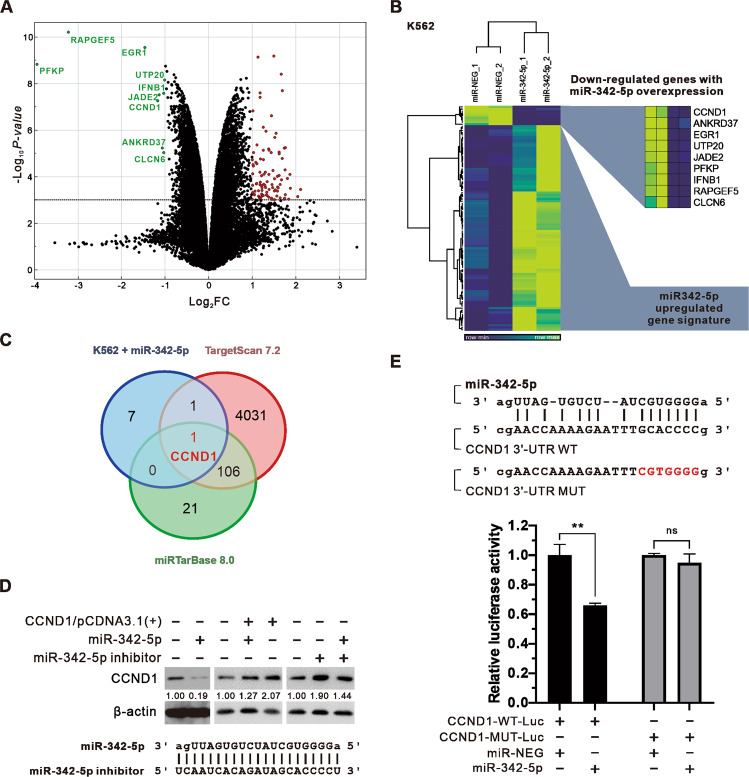
Fig. 3. Combining experimental validation and prediction of miRNA target database with microarray analysis to find CCND1 as the target of miR-342-5p.
A Volcano plot showing the distribution of differentially expressed genes with miR-342-5p expression. The red dots represent significantly upregulated genes, and the green represents significantly downregulated genes. Filtering criteria: |Log2FC | ≧ 1, −Log10 p-value >3. B Heat map presents the relative expression and hierarchical clustering of differentially expressed genes with or without miR-342-5p expression. C Venn diagram presents the results of the intersection of K562 expressing miR-342-5p downregulated gene (blue circle), TargetScan predicting miR-342-5p target gene (red circle), and miRTarBase experiment validated miR-342-5p target gene (green circle). D Western blot to confirm the expression of CCND1 affected by miR-342-5p (20 nM) or miR-NEG (20 nM) transfection combined with CCND1/pCDNA3.1(+)(3 μg) or miR-342-5p inhibitor (50 nM). The sequence of the utilized miR-342-5p inhibitor is shown below. E The miRANDA-predicted miR-342-5P sequence is aligned with the CCND1 3′-UTR WT target sequence. Sequences with manipulated mutations in the CCND1 3′-UTR MUT are shown in red. Luciferase activity assay shows the relative intensity of luminescence generated by CCND1-WT-Luc or CCND1-MUT-Luc (0.4 μg) under miR-342-5p or miR-NEG expression (20 nM). Student’s t-test assessed the statistical significance of the difference between miR-342-5p and miR-NEG, ns: no significant differences; **P < 0.01.

