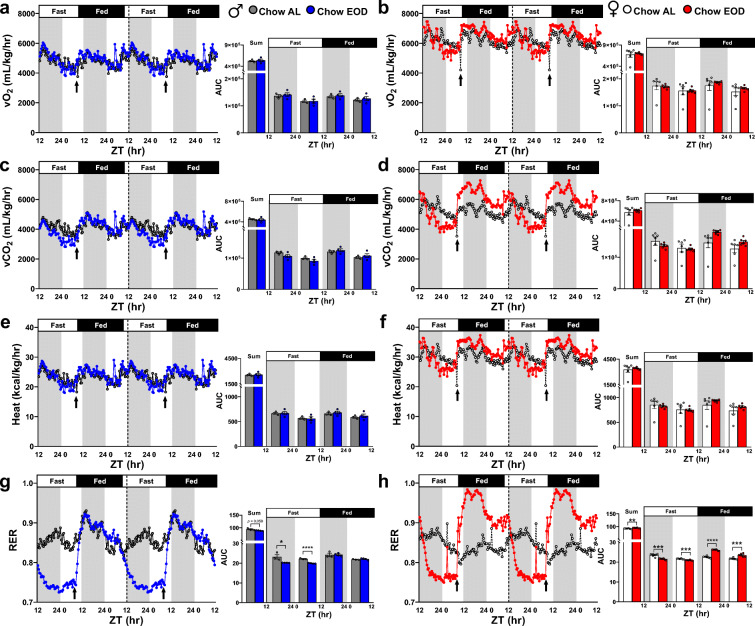
Fig. 3.
Late-life EOD fasting affects lean mass-adjusted resting metabolism. a–h The lean mass-adjusted average vO2 (mL/kg/hr), vCO2 (mL/kg/hr), and heat (kcal/kg/hr), as well as RER, were measured approximately every 20 min over the 4-day period in the metabolic chamber in the male (a, c, e, g) and in female (b, d, f, h) Chow AL and Chow EOD groups (n = 3–6 mice per sex per group). The figures (a–h) depict the mean with no error bars for a representation purpose, while the insets show the AUC of combined/summation of area, fast day 12:12 light:dark cycle, and fed day 12:12 light:dark cycle for each measure. The inset figures depict the mean with error bars (± SEM). The asterisks indicate the significant difference between the same-sex Chow AL and Chow EOD groups. *p < 0.05, **p < 0.01, ***p < 0.001, and ****p < 0.0001

