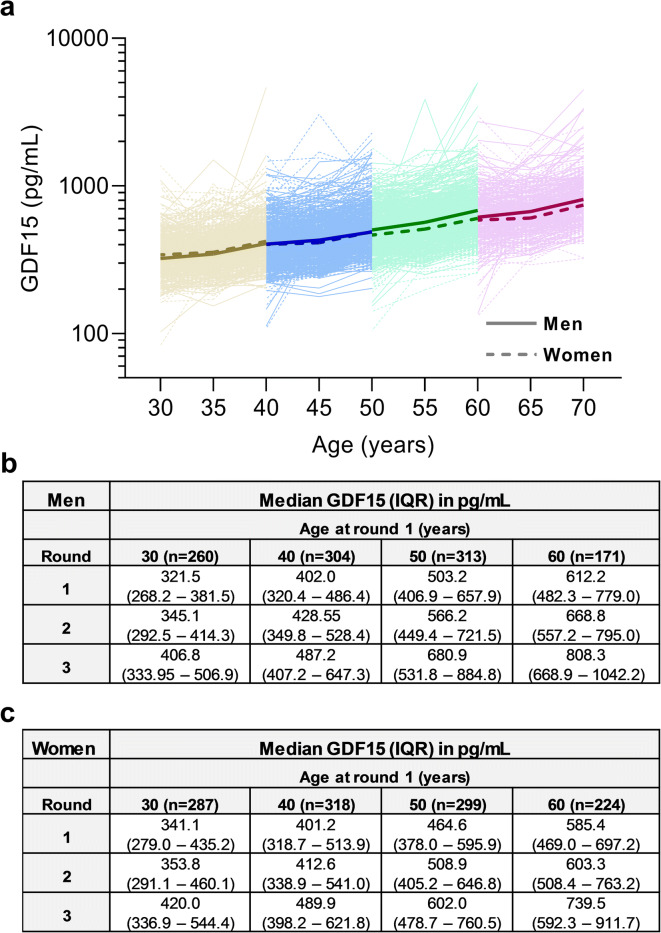
Fig. 1.
The natural time course of GDF15 levels over the 10-year study period within each age category and by gender. a Individual GDF15 values for participants aged 30, 40, 50, and 60 years at round 1 are displayed on a logarithmic scale, and median values for men (solid line) and women (dashed line) are shown as bold lines. b Median GDF15 values for men. c Median GDF15 values for women

