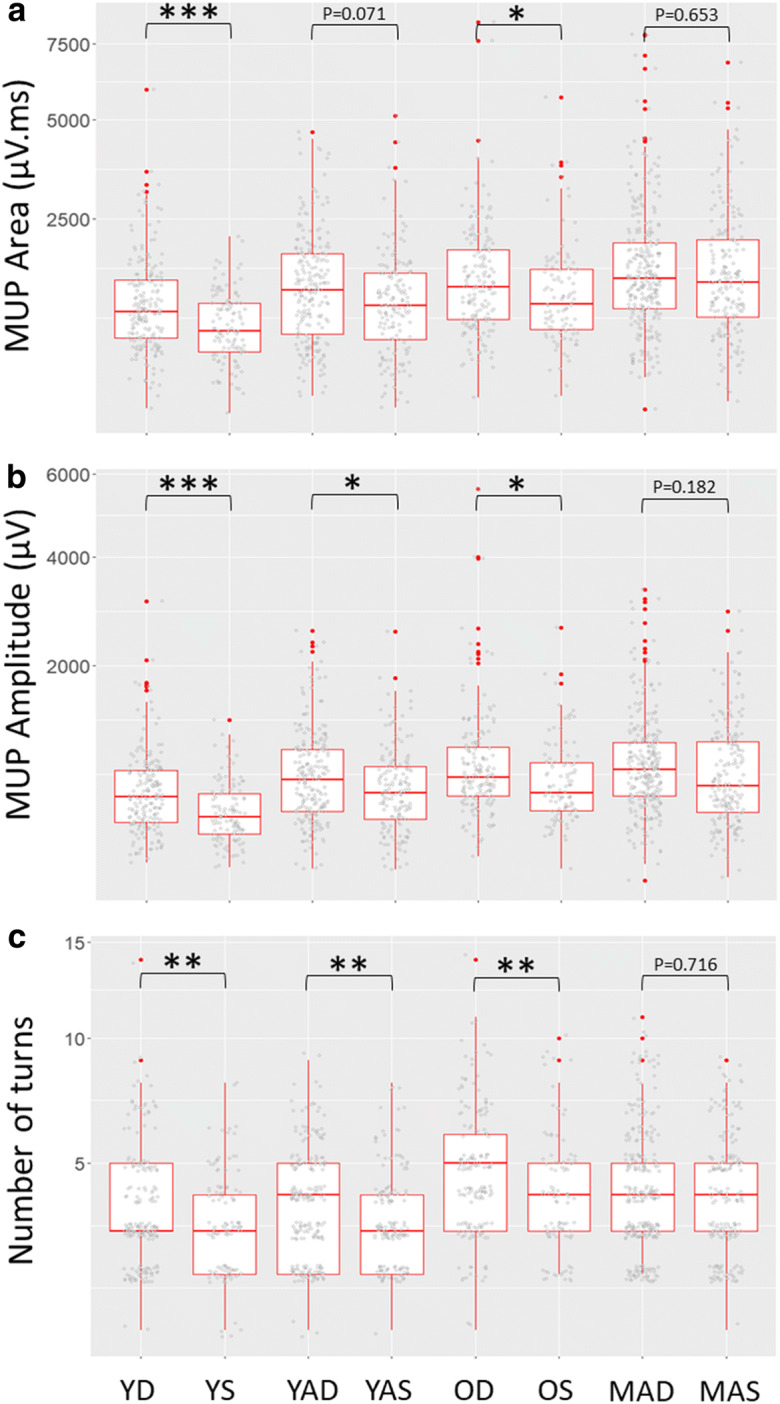
Fig. 1.

Individual data points and box plots (median + 25th/75th percentile) for motor unit potential (MUP) area (a), MUP amplitude (b) and discrete number of turns (c) for young controls (Y), young athletes (YA), old controls (O) and master athletes (MA) for deep (D) and superficial (S) MUs of the vastus lateralis. *p<0.05, **p<0.01. All MUs presented for data visualisation however statistical analyses are based on multilevel mixed effects linear models to account for data clustering
