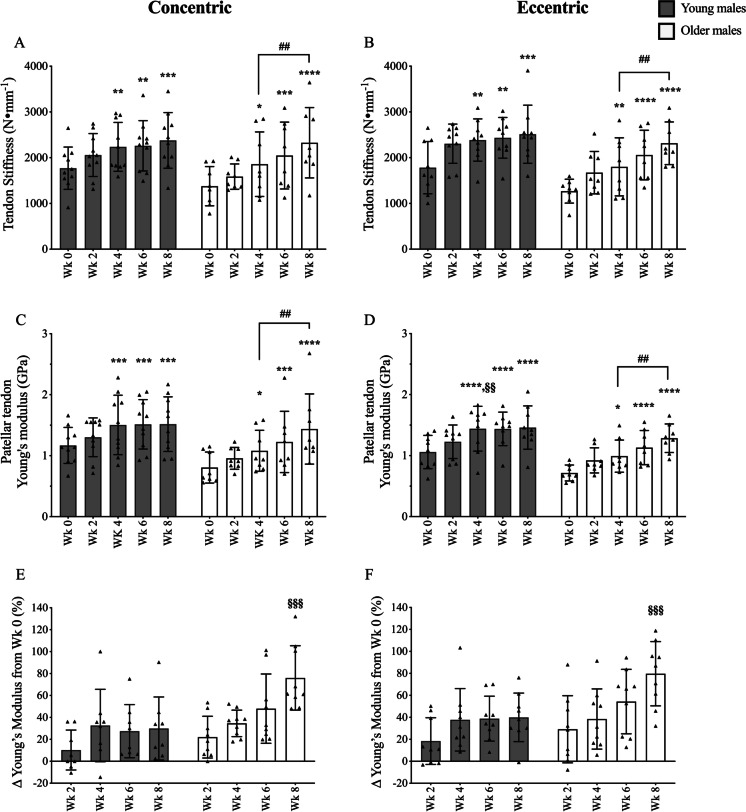
Fig. 1.
Time course of the patellar tendon biomechanical adaptation in response to submaximal CON (A, C, E) or ECC RET (B, D, F). N values for groups were as follows: YC, n = 10; YE, n = 9; OC, n = 8; and OE, n = 8. P values for time point vs baseline in respective group * P < 0.05, ** P < 0.01, *** P < 0.001, **** P < 0.0001. P values for week 4 vs week 8 in respective group, ## P < 0.01. P values for young vs old at respective time point §§ P < 0.01, §§§ P < 0.001

