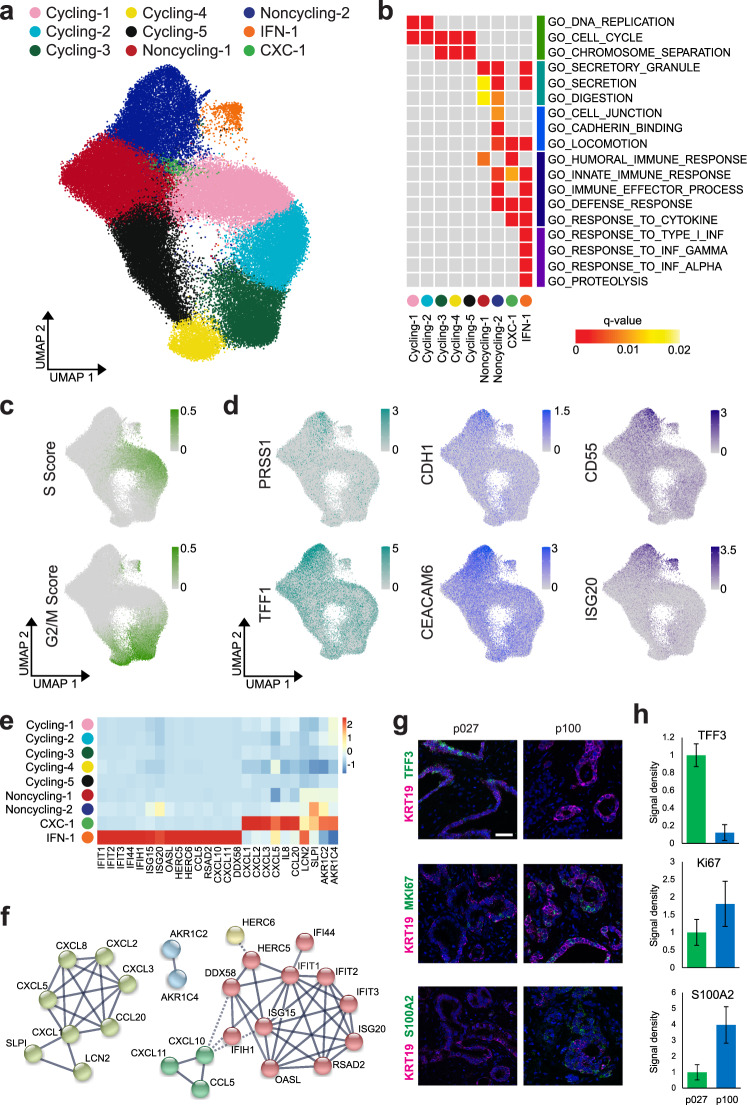
Fig. 3. Functional cell states shared across PDAC patients.
a UMAP representation of clusters shared across patients, after PCA-based integration of PDAC transcriptomes from 18 primary PDAC organoid lines. b Gene ontology (GO) term enrichment analysis using the top 100 upregulated genes per cluster. Gray boxes indicate no significant enrichment. c Cell cycle scores for each cell, computed based on the expression of S and G2/M phase genes, were visualized using the same UMAP representation as in (a). d Expression of characteristic genes across all cells from primary PDAC organoid lines, visualized using the same UMAP representation as in (a). e The heatmap shows the average expression per cluster of genes specifically enriched in clusters CXC-1 and IFN-1 with interactions recorded in the STRING database55. f Networks representing gene interactions considered in (e). g Representative images of RNA fluorescence in situ hybridization (FISH) staining for KRT19 indicating PDAC cells (magenta) together with either TFF3, MKI67, or S100A2 (green) in primary tumor sections from p027 and p100. Nuclei are stained with DAPI (blue). Scale bar, 50 µm. FISH staining was repeated twice on individual sections with similar results. h Quantification of RNA FISH stainings shows the signal density per nucleus for each transcript in PDAC cells (identified by KRT19 staining), normalized to the density in sample p027 (p027: n = 339 nuclei for MKI67 and TFF3, 369 nuclei for S100A2; p100: n = 176 nuclei for MKI67 and TFF3, 306 nuclei for S100A2; each from three separate images, with error bars showing standard errors in the mean).

