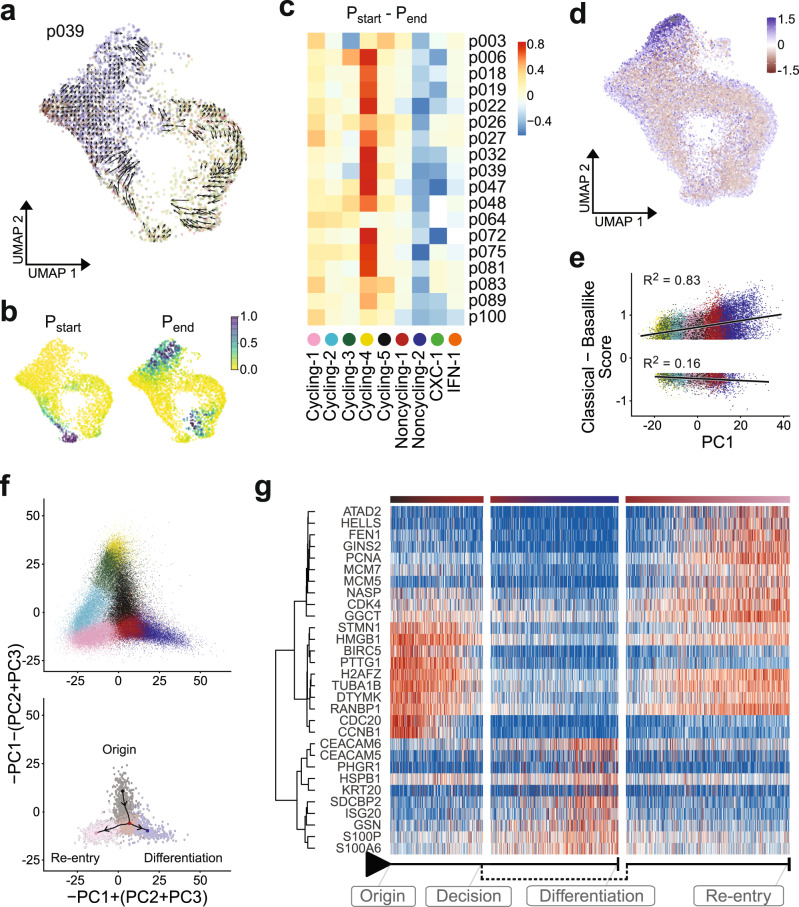
Fig. 4. Differentiation hierarchy of PDAC cell states in vitro and in vivo.
a RNA velocity trajectory shown for p039, using the same UMAP representation as in Fig. 3a. b Startpoint (top) and endpoint (bottom) probabilities shown for p039. c Difference between the average startpoint (red) and endpoint (blue) probabilities within each cluster (columns) across all PDAC organoid samples (rows). d Distribution of PDAC subtypes in single cells along the lineage trajectory. Colors indicate whether a cell exhibits higher expression of ‘classical’ (blue) or ‘basal-like’ (red) subtype marker genes. e Correlation of PDAC subtype scores with cell embeddings in the first principal component, which distinguishes cycling cells (negative values in PC1) from differentiating cells (positive values in PC1). f Projection of all cells onto a linear combination of PC1, PC2, and PC3 to visualize cycling and differentiating cells (top). Cells in the four clusters around the trajectory bifurcation point were linked by a minimum spanning tree (bottom). g Expression of genes with dynamic changes along the bifurcation branches (red: high, blue: low), with hierarchical clustering of gene expression shown on the left. Column annotations indicate position along the branches.

