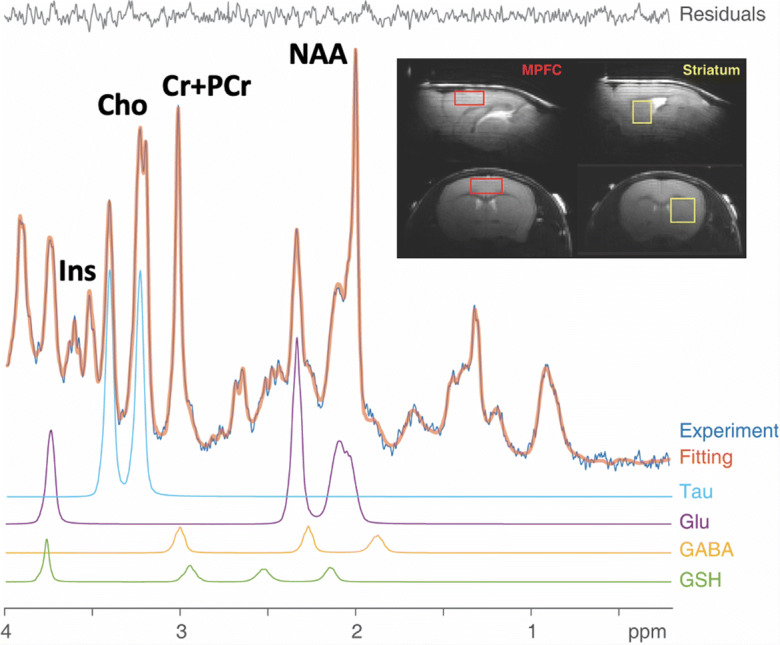
Fig. 1.

Sample medial prefrontal cortex (MPFC) MRS scan from an aged Tat-tg mouse. Shown are the original data (light blue trace), spectrum fit (brown trace for the entire spectrum, and fit residuals. To illustrate LC Model peak fitting, taurine (Tau), glutamate (Glu), GABA, and glutathione (GSH) peak fits are shown below the complete spectrum. Additional peaks that were quantifiable with high precision were N-acetylasparate (NAA), creatine + phosphocreatine (Cr+PCr), choline (Cho), and myo-inositol (Ins). Insets: MPFC and striatum MRS Voxels (red and yellow boxes, respectively) overlaid on sagittal (top row) and coronal (bottom row) MRI images (A, anterior; P,posterior; R,right; L, left)
