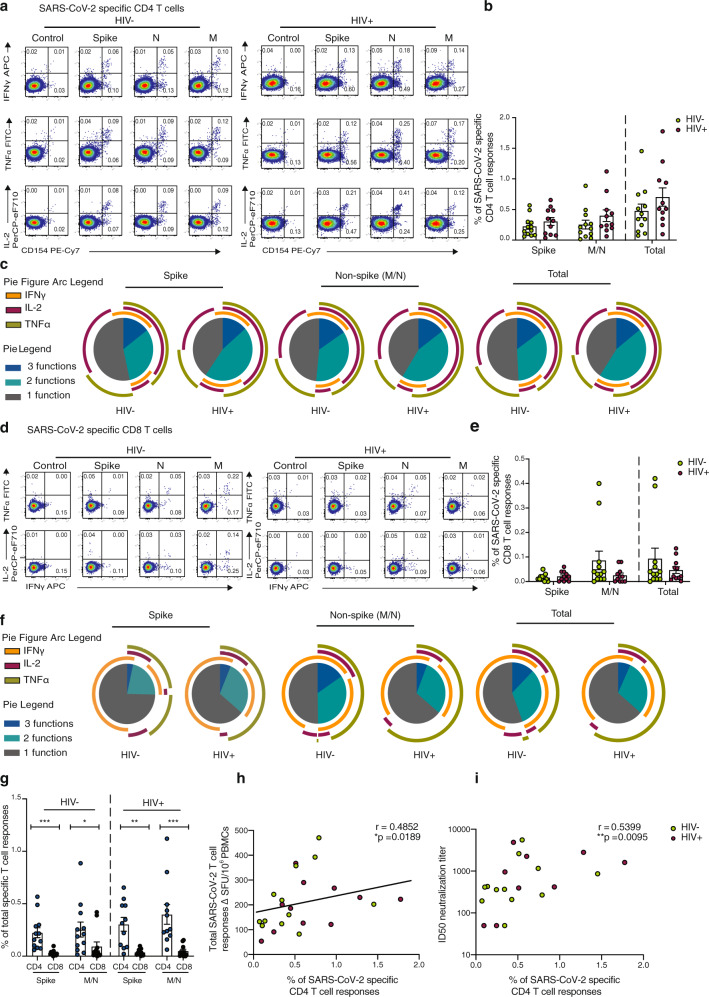
Fig. 4. Composition of SARS-CoV-2-specific T cells in convalescent HIV-negative and HIV-positive individuals.
Intracellular cytokine staining (ICS) was performed to detect cytokine-producing T cells to the indicated peptide pools in HIV-negative (HIV−, n = 12) and HIV-positive individuals (HIV+, n = 11). a Representative flow cytometric plots for the identification of antigen-specific CD4 T cells based on double expression (CD154+IFN-γ+, CD154+IL-2+, and CD154+TNF-α+) following 6-h stimulation with media alone (control) or overlapping SARS-CoV-2 peptides against Spike pool 1 and 2 (Spike), Nucleoprotein (N), and Membrane protein (M) directly ex vivo. b Frequency of aggregated CD4 T-cell responses (CD154+IFN-γ+, CD154+IL-2+, and CD154+TNF-α+) against Spike, M/N or combined (Spike and M/N) peptide pools (HIV−, n = 12; HIV+, n = 11). Error bars represent SEM. c Pie charts representing the relative proportions of Spike, M/N, or total (combined Spike and M/N) CD4 T-cell responses for one (gray), two (green) or three (dark blue) cytokines, and pie arcs denoting IFN-γ, TNF-α and IL-2. d Representative flow cytometric plots for the identification of antigen-specific CD8 T cells based on the expression of (IFN-γ+, TNF-α+, and IL-2+) against the specified peptide pools or media alone (control). e Proportion of aggregated CD8 T-cell responses against Spike, M/N or combined (Spike and M/N) responses in HIV− (n = 12) and HIV+ (n = 11) donors. Error bars represent SEM. f Pie charts representing the relative proportions of Spike, M/N and combined CD8 T-cell responses for one (gray), two (green) or three (dark blue) cytokines, and pie arcs showing IFN-γ, TNF-α and IL-2. g Comparison of the frequencies of summed SARS-CoV-2-specific CD4 and CD8 T-cell responses against Spike in n = 12 HIV− donors (p = 0.0004) and n = 11 HIV+ (p = 0.001) and M/N proteins (HIV−, p = 0.042; HIV+, p = 0.0009). Error bars represent SEM. h Correlation between the frequency of total SARS-CoV-2-specific CD4 T cells and overall T-cell responses detected by IFN-γ ELISpot responses or i ID50 neutralization titer (log10) in HIV-negative (n = 12) and HIV-positive (n = 11) individuals. The non-parametric Spearman test was used for correlation analysis (two-tailed); p values for individual correlation analysis within groups, HIV− (green) or HIV+ (red) or combined correlation analysis (black) are presented. Significance determined by two-tailed Mann−Whitney U test or Wilcoxon matched-pairs signed rank test, *p < 0.05, **p < 0.01, ***p < 0.001. SPICE was used for polyfunctional analysis.

