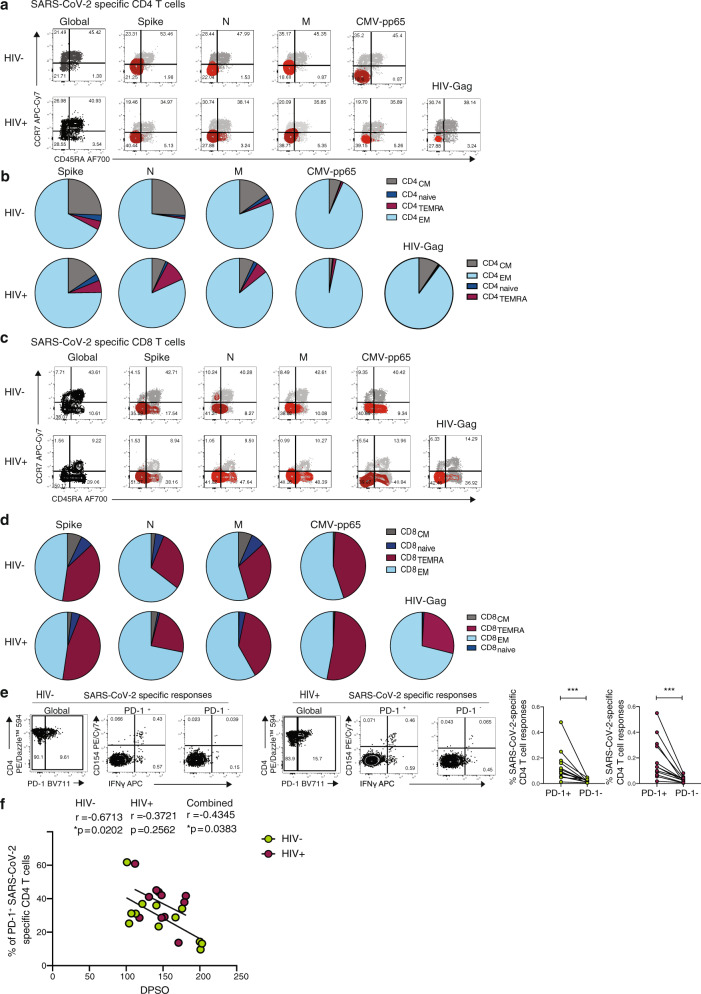
Fig. 5. Phenotypic characterization of SARS-CoV-2-specific CD4 and CD8 T cells from convalescent HIV-negative and HIV-positive subjects.
a Representative flow plots and b pie charts representing the proportion of antigen-specific CD4 T cell with a CD45RA−/CCR7+ central memory (CM), CD45RA+/CCR7+ naïve, CD45RA+/CCR7− terminally differentiated effector memory (TEMRA) and CD45RA−/CCR7− effector memory (EM) phenotype from HIV-negative (HIV−, n = 12) and HIV-positive individuals (HIV+, n = 11) against SARS-CoV-2 Spike, M, N, CMV pp65 and HIV gag. c Representative flow plots and d pie charts representing the proportion of CD45RA−/CCR7+ central memory (CM), CD45RA+/CCR7+ naïve, CD45RA+/CCR7− terminally differentiated effector memory (TEMRA) and CD45RA−/CCR7− effector memory (EM) antigen-specific CD8 T-cell subsets against SARS-CoV-2 Spike, M, N, CMV pp65 and HIV gag. e Representative flow plots from an HIV-negative donor (HIV−) and an HIV-positive donor (HIV+) showing expression of CD154 and IFN-γ production from PD1+ and PD1− SARS-CoV-2-specific CD4 T cells and paired analysis of responses in HIV-negative (HIV−, n = 12, p = 0.0005) and HIV-positive (HIV+, n = 11, p = 0.001) individuals. f Correlation between frequency of PD-1+CD154+IFN-γ+ SARS-CoV-2-specific CD4 T cells and DPSO in both groups. Significance determined by Wilcoxon matched-pairs signed rank test, *p < 0.05, ***p < 0.001. The non-parametric Spearman test was used for correlation analysis; two-tailed p values for individual correlation analysis within groups, HIV−, HIV+, or combined correlation analysis (black) are presented.

