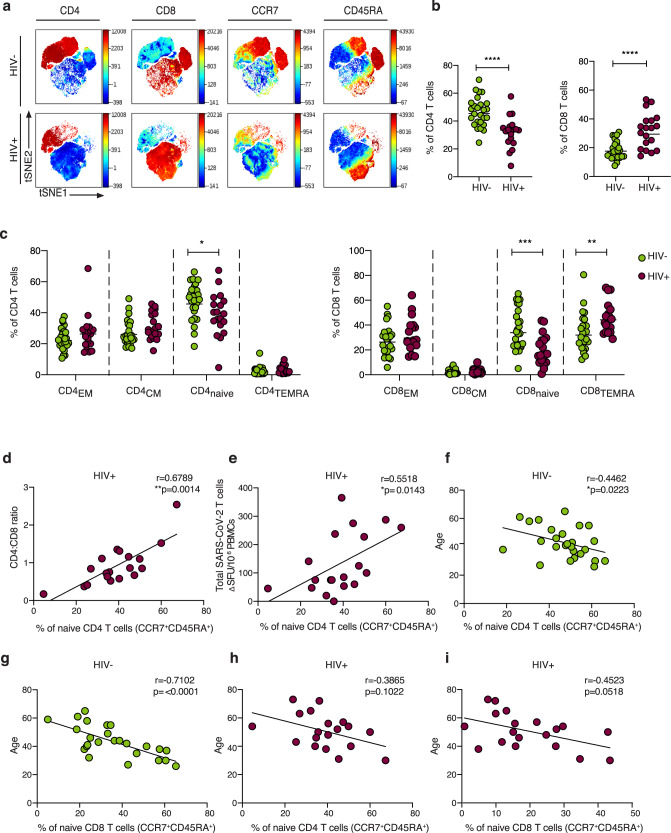
Fig. 6. Immune profile relationships between convalescent HIV-positive and -negative individuals.
a viSNE analysis of CD3 T cells in HIV-negative (top panel) and HIV-positive donors (lower panel). Each point on the high-dimensional mapping represents an individual cell, and color intensity represents the expression of selected markers. b Frequency of CD4 and CD8 T cells out of total lymphocytes in SARS-CoV-2 convalescent HIV-negative (HIV−, n = 26) and HIV-positive individuals (HIV+, n = 19) via traditional gating (p < 0.0001). Plots show the geometric mean. c Summary data of the proportion of CD45RA−/CCR7+ central memory (CM), CD45RA+/CCR7+ naïve, CD45RA+/CCR7− terminally differentiated effector memory (TEMRA) and CD45RA−/CCR7− effector memory (EM) CD4 and CD8 T-cell subsets in the study groups (HIV−, n = 26; HIV+, n = 19). Higher frequencies of naïve CD4 and CD8 T cells and lower frequencies of CD8 TEMRA in the HIV− compared to the HIV+ group are depicted (p = 0.0195, p = 0.0006 and p = 0.0036 respectively). Plots show the geometric mean. d Correlation between CD4:CD8 ratio and frequency of naïve CD4 T cells in HIV-positive individuals. e Correlation between frequency of naïve CD4 T cells and total SARS-CoV-2 T-cell responses, detected via ELISpot, in HIV-positive individuals. f Correlation between frequency of naïve CD4 T cells and g naïve CD8 T cells and age in HIV-negative individuals. h Correlation between frequency of naïve CD4 T cells and i naïve CD8 T cells age in HIV-positive donors. Significance determined by two-tailed Mann−Whitney U test, *p < 0.05, **p < 0.01, ***p < 0.001, ****p < 0.0001. The non-parametric Spearman test was used for correlation analysis (two-tailed).

