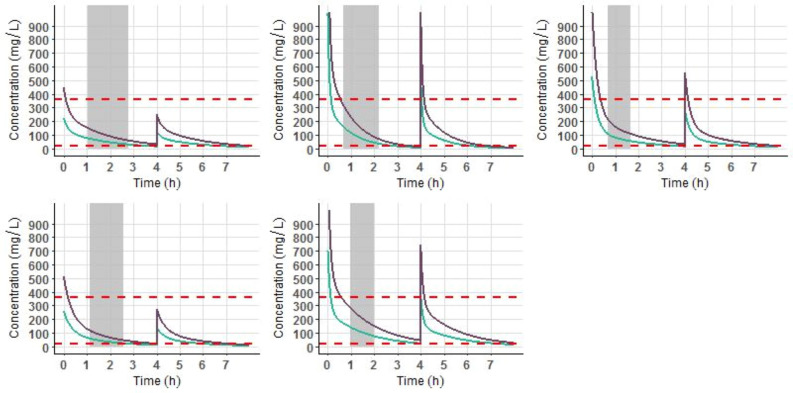
Figure 5.
Simulations of the concentration–time course of cefazolin for the five patients included in the study with BMI > 35 kg/m2 and total body weight > 100 kg after a 4000 mg bolus followed by a 2000 mg at 4 h (purple line) and after a 2000 mg bolus followed by a 1000 mg at 4 h (green line). The red dashed lines correspond to the 20 and 360 mg/litre concentration thresholds. Grey stripe represents to the surgery duration. Simulations were performed using R software (version 3.2.2) with the ggplot2 package (version 2.1.0). R Core Team (2016). R: A language and environment for statistical computing. R Foundation for Statistical Computing, Vienna, Austria. URL https://www.R-project.org/. Wickham H (2016). ggplot2: Elegant Graphics for Data Analysis. Springer-Verlag New York. ISBN 978–3-319–24,277-4, https://ggplot2.tidyverse.org.

