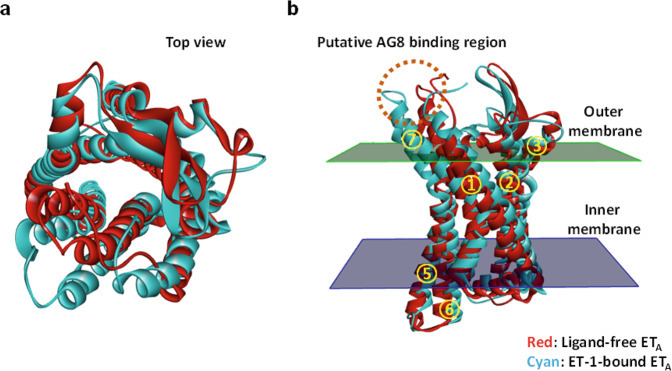
Fig. 6. Conformational change in the hETA model structure induced by ET-1 binding.
a Structures of ligand-free ETA (red) and ET-1-bound ETA (cyan). The structures are viewed from the outside of the cell (top view). b The structure as viewed from the side. The binding site of AG8 predicted by protein docking analysis is represented by a dotted circle. The numbers 1 through 7 in the yellow circles indicate the transmembrane domain of hETA.

