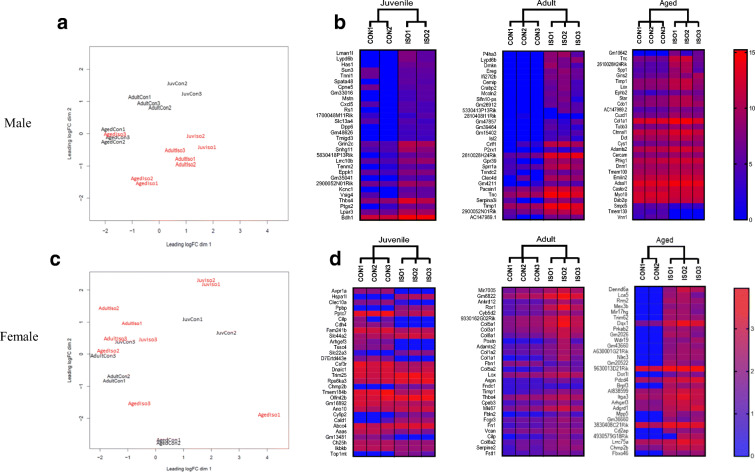
Fig. 3.
RNAseq analysis of control (CON) and isoproterenol (ISO) by sex and age. a Principal component analysis in male mice. b Heatmap of gene expression comparing male CON and ISO by age. Thirty genes with the highest/lowest log fold change are displayed (significance was set at FDR < 0.05). c Principal component analysis in female mice. d Heatmap of gene expression comparing female CON and ISO by age. Thirty genes with the highest and lowest log fold change are displayed (significance was set at FDR < 0.05, except for juvenile female, FDR was set at 0.1, due to very low number of genes at 0.05)

