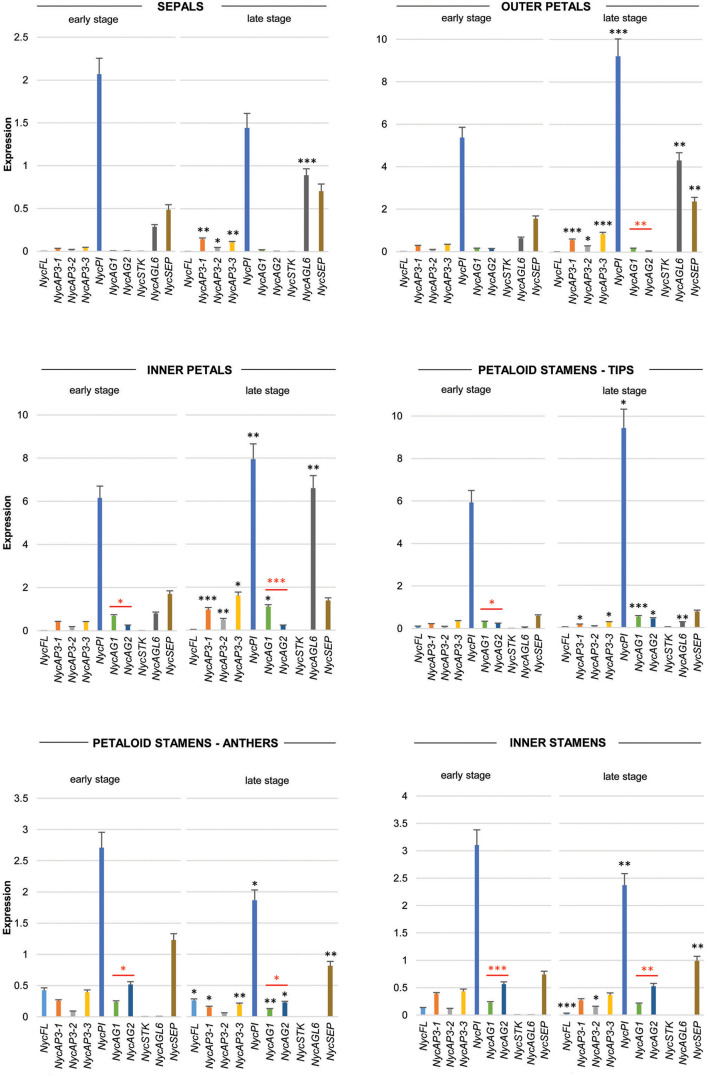
FIGURE 3.
Analysis of MADS-box gene expression during sepals, petals, and stamens development. Expression profiles of MADS-box genes in floral components (sepals, petals, petaloid stamens, and inner stamens) obtained from floral buds at two different stages of development (early and late stages, respectively) by qPCR experiments. Values in the graphs represent initial RNA quantities ± SEM. Black asterisks above an expression level indicate a significant difference between the two developmental stages, for that specific gene. Red asterisks indicate a significant difference of the expression levels of genes under the red bar (∗p < 0.05; ∗∗p < 0.01; ∗∗∗p < 0.001).

