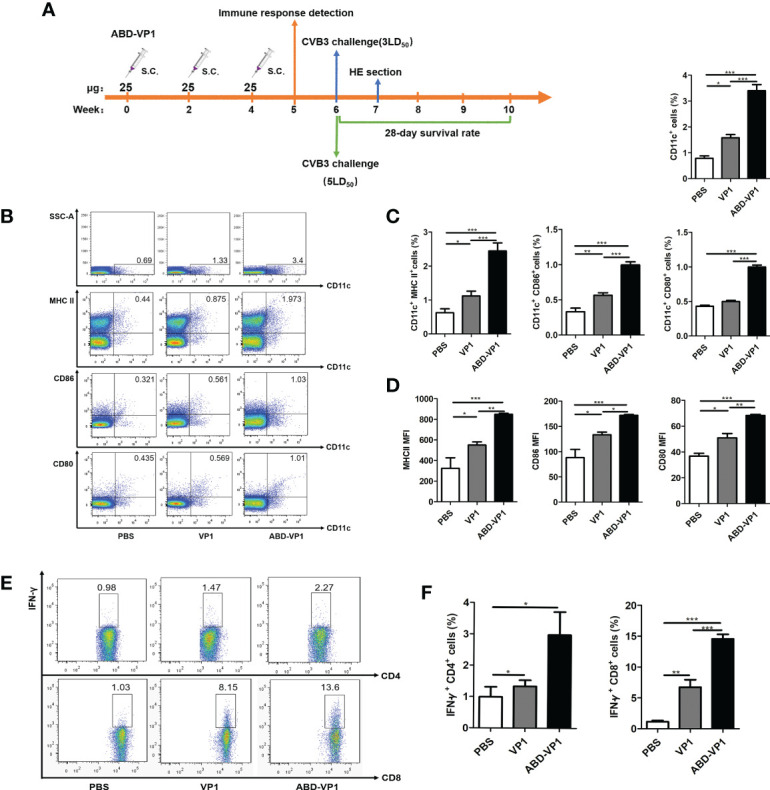
Figure 3.

ABD-VP1-induced local immune responses in the dLNs. (A) Schematic diagram of the immunization procedure. (B) FACS analysis of DC recruitment and maturation in the dLNs of immunized mice. (C) Statistical analysis of (B). (D) Mean fluorescence intensity (MFI) of MHC II, CD86 or CD80 molecule on CD11c+ DC in the dLNs. (E) FACS analysis of IFN-γ+ CD8+ and IFN-γ+ CD4+ cells in the dLNs (unstimulated background has been subtracted). (F) Statistical analysis of (E). Each group contained 8 mice. *P < 0.05; **P < 0.01; ***P < 0.001.
