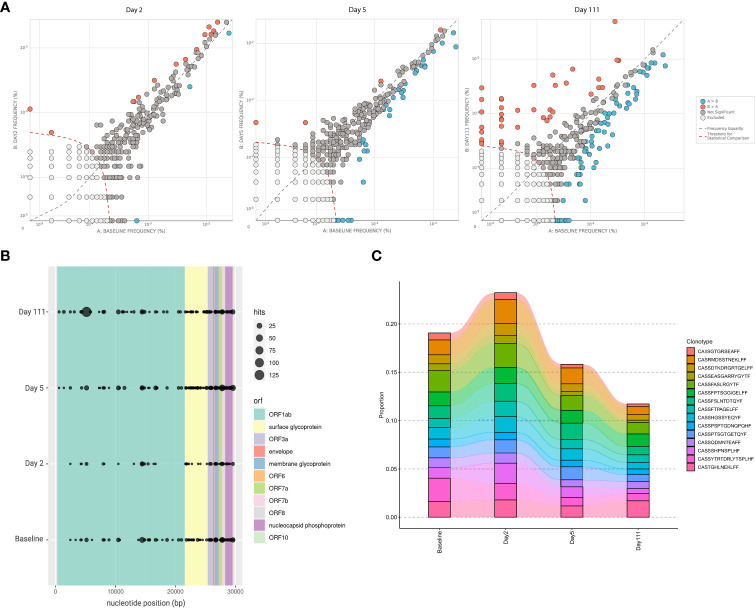
Figure 3.
T cell repertoire sequencing of patient at study time points. (A) Differential abundance analysis comparing clonotypes that have significantly increased or decreased in frequency across baseline and post-infection Day 2, Day 5, and Day 111. This is based on a beta-binomial model where normal repertoire changes in healthy adults over time are accounted for while measuring clonal expansion. (B) Locations on the SARS-CoV-2 genome where TCR binding has likely occurring; different colours specify open reading frame, and size of dots indicate number of TCRβ rearrangements associated with SARS-CoV-2 at a particular position. Screening was performed based on the ImmuneCODE database (Adaptive Biotechnologies). (C) Changes in frequencies of the 15 most frequently observed TCR clonotypes, relative to total TCR repertoire, across baseline and post-infection day 2, 5, and 111.

